
How to Best Evaluate Market Share

Understanding how your business fits into the bigger market picture isn’t just interesting—it’s essential. Market share tells you what portion of the total market your company controls, offering a straightforward way to see how you’re doing compared to competitors. It can also reveal new opportunities or risks you might be missing. For example, a 2023 McKinsey report found that companies who actively track their market share are 2.5 times more likely to outperform their industry peers.1 But measuring market share is not always as simple as it seems. It’s easy to misjudge your true position if you don’t define the market or pick your competitors carefully. In this article, we’ll break down practical, step‑by‑step ways to evaluate market share accurately, so you can make smarter decisions for your business or project.
1Source: McKinsey & Company, “The Value of Market Share Metrics,” 2023.
Defining Market Share in Context
What Market Share Really Measures
Market share is all about proportion. It tells you how much of a specific market your company or product claims compared to others in the same field. Instead of focusing on abstract growth or success, market share answers a much simpler question: out of everyone selling similar things, what slice of the whole do you own?
For established companies, even a small increase in market share can mean outpacing major rivals. For upstarts, breaking through with just a sliver indicates traction and potential. This percentage goes beyond sales numbers; it reveals presence, relevance, and sometimes influence within your industry’s playing field.
Market Share vs. Market Size vs. Market Power
Getting the terminology right makes a difference. Market share should not be confused with market size or market power. Market size refers to the total pool of potential revenue or unit sales in a defined market. It answers the question: how big is the pond? Market share, by contrast, says how much of that pond belongs to you.
There’s also market power, which isn’t a direct measurement but an interpretation—how much leverage a company has to control prices, set standards, or influence competitors. Sometimes, market power follows naturally from an outsized share, but not always. Niche players, for example, can command a loyal corner and wield more power than their numbers might suggest.
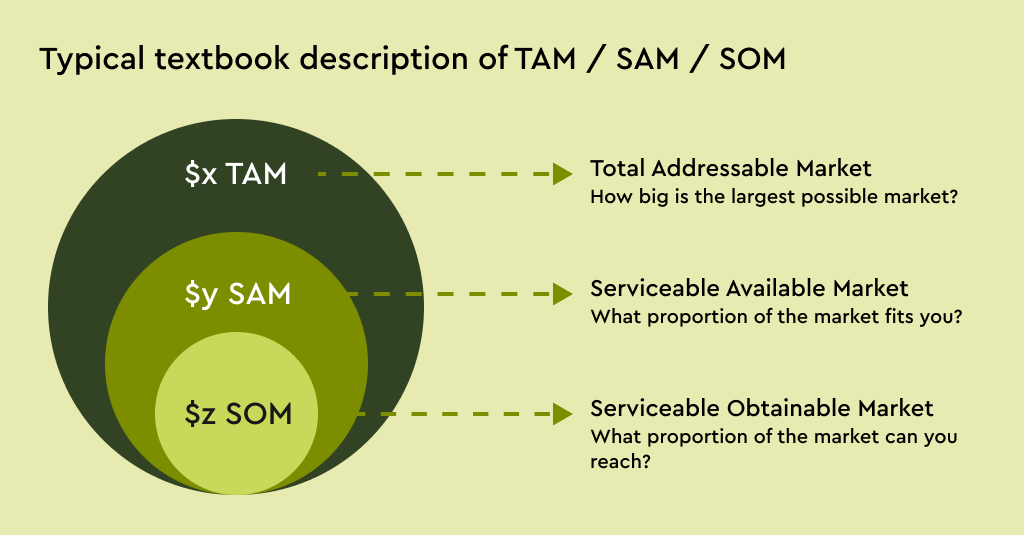
The image above illustrates the distinction between Total Addressable Market (TAM), Serviceable Available Market (SAM), and Serviceable Obtainable Market (SOM). These concepts help break down the larger environment your market share fits into and clarify why precise definitions matter.
With these definitions clear, you’re ready to dig into the actual process of calculating and comparing your position within the marketplace. Next, we’ll walk through straightforward methods to put numbers to your share and show how to move from simple formulas to actionable insights.
Core Methods to Calculate Market Share
The Classic Market Share Formula
At its core, market share tells you what portion of an entire market your company captures. The typical formula looks like this: Market Share = (Your Company’s Sales / Total Market Sales) × 100%. Plug your own sales or revenue into the equation, compare it to the overall market total, and you’ll see your percentage of the pie. This approach works for most industries, from packaged food to smartphones.
Revenue-Based vs. Unit-Based Calculations
There’s more than one way to measure market share, depending on what matters in your industry. Revenue-based calculations use total money earned. This works well if prices vary a lot or if the market is premium-driven—like luxury cars or software subscriptions. On the flip side, unit-based calculations count the actual number of items sold. This method shines in industries where units are relatively interchangeable, such as bottled beverages or smartphones. For the most accurate view, pick the method that matches how the market values what you sell.
Worked Example: Step-by-Step Calculation
Let’s put theory into action. Imagine you run a company selling fitness trackers. If your revenue this year is $8 million, and total sales for all competitors add up to $40 million, here’s how you’d calculate market share:
So, your fitness tracker business controls 20% of the market by revenue. Swap in units sold, and you’ll see how your share changes—often a useful check in price-sensitive markets.
With these calculation methods in mind, you’re ready to refine your evaluation by thinking carefully about which markets and rivals actually matter for your analysis. Let’s look at how to set those boundaries clearly and find the data you need.
Choosing Your Market and Competitors Wisely
Defining the Relevant Market for Evaluation
Nailing down your market starts with precision. Think beyond vague industries or catch-all labels. Focus on what you sell, who buys it, and where those customers could turn instead. This means setting boundaries: Is your market strictly local, regional, or global? Are you looking at all potential customers or just those truly willing and able to buy from you?
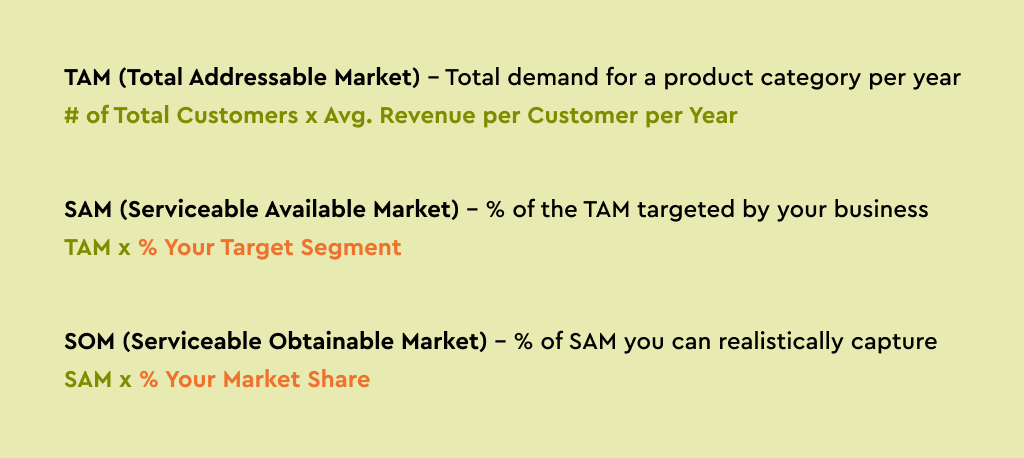
Use frameworks like Total Addressable Market (TAM), Serviceable Available Market (SAM), and Serviceable Obtainable Market (SOM) to map out scope. TAM gives you the entire universe, SAM filters for buyers who fit your focus, and SOM pinpoints where you can win based on your reach. Precision here keeps calculations honest and actionable.
Sources for Accurate Market Data
Relying on instincts or anecdotal evidence won’t cut it. Instead, draw from industry reports, government databases, and analyst insights. Examples include IDC, Statista, industry associations, and trade publications. Public company filings and competitor financials can also reveal the size and shape of different market slices. Layer multiple sources—you’ll spot patterns and spot outliers.
Identifying True Market Competitors
Not everyone selling in your niche is meaningful competition. Hone in on businesses chasing the same customer segments, solving similar problems, and playing at a similar scale. Pay attention to both direct competitors (those offering nearly the same solution) and credible alternatives—sometimes the biggest threat wears a different hat. Revisiting your competitor list regularly is key, as new challengers or substitutes often slip in quietly.
Defining your market boundaries and mapping the real competitive field sets the stage for accurate calculation. Next, you’ll need to dive deeper into how to track changes in market position and spot movement across segments and regions—details that reveal much more than a simple percentage ever could.
Beyond the Basics: Evaluate Market Share with Deeper Insight
Tracking Market Share Over Time
Market share isn’t a snapshot—it’s a story that unfolds quarter by quarter and year by year. Looking at share as a static number can hide important shifts beneath the surface. By analyzing your performance over several periods, you can identify whether your share is plateauing, climbing, or eroding, which often tells you more than the number itself. Persistent gains—or losses—can signal emerging strengths or hidden threats before they show up in profit and loss statements.
Segment-Specific and Regional Shares
Industry averages rarely tell the whole truth. Your overall market share might look stable, but underneath, share may be growing fast in one segment while shrinking in another. Break down your data by product category or customer segment to isolate areas of momentum or vulnerability. Similarly, drill down by region: a national market share of 10% may mask a dominant local presence or a lagging foothold somewhere else. These nuances reveal real opportunities for smarter decisions.
The Role of Market Trends and Growth Rates
Numbers need context. Even if your share is rising, it’s crucial to view it against the backdrop of industry growth rates and trends. Outperforming a shrinking market isn’t the same as outpacing competitors in a booming sector. Examine external trends—like new technology adoption, regulatory shifts, or demographic swings—that could shake up the competitive order. Blend this insight with your share data to anticipate challenges or seize fresh openings before they go mainstream.
By moving beyond surface-level calculations and exploring these deeper layers, you build a richer picture of your position and uncover hidden angles for growth. Next, we’ll look at common stumbling blocks and how to avoid pitfalls that can derail even the most thorough analysis.
Don’t Settle for Guesswork—Take Action With Your Market Insights
Knowing your market share is only the first step. Making it work for you is where things get interesting. The difference between hearing “nice numbers” and actually moving ahead lies in what you do next. Turn research into real impact—because a sharper view of your position is your edge, not just a stat for your next quarterly report.
Ready to skip the vanity metrics and dig into actionable market insight? It’s time to check your process for the most common evaluation mistakes, so you can avoid pitfalls that trip up even seasoned pros.
Common Mistakes in Market Share Evaluation
Misdefining the Addressable Market
Many businesses fall into the trap of calculating their market share based on an overly broad or imprecise market definition. For example, a local bakery considering itself a player in the entire “global food market” will distort both its market share and its ability to spot real opportunities or threats. The key is to clearly outline the actual segment you serve, whether that’s by geography, product type, or customer profile. Overestimating your addressable market leads to inflated figures and false confidence, while underestimating it can hide your real potential.
Relying on Unreliable Data Sources
Using outdated reports, biased industry publications, or anecdotal guesses instead of credible data is a shortcut to misleading results. It’s tempting to grab free numbers off the internet, but data accuracy and provenance are vital. Look for reputable market research, recent studies, and, when possible, directly sourced industry numbers. Remember: one wrong number in your equation compromises your entire analysis.
Ignoring Niche or Emerging Competitors
Overlooking smaller rivals or disruptive newcomers can leave you blind to real competition. Many firms focus only on obvious, established players, missing agile startups or niche brands that are quietly siphoning away market share. Spotting these competitors early on can reveal both threats and inspiration for strategic moves.
Avoiding these pitfalls lays a stronger foundation for understanding your share of the market. Next, let’s see which tools and data sources can help you track these numbers reliably and in real time.
Tools and Data Sources for Tracking Market Share
Top Market Research Databases and Reports
For accurate market share analysis, you need more than a quick Google search. Established market research providers—such as Statista, IBISWorld, and Gartner—supply up-to-date industry data, competitor breakdowns, and thorough analyses. These reports often include detailed tables that reveal both overall market size and specific company performance, making them ideal for baseline comparisons. While access usually comes at a cost, the reliability and breadth of coverage help eliminate guesswork.
Utilizing Financial Statements and Industry Benchmarks
Publicly traded competitors must file quarterly and annual reports, which are goldmines for calculating relative revenues and volumes. Look to SEC filings (like 10-Ks) to map out a company’s actual footprint within its segment. Meanwhile, industry groups or trade associations publish regular benchmark studies—think of sector-specific resources such as the National Restaurant Association or NPD Group. These offer aggregated data points that help validate your own figures or estimates.
Leveraging Surveys and Customer Data
If you’re targeting a specific region or customer segment, don’t overlook first-hand information. Custom surveys, Net Promoter Score trackers, and CRM exports can expose real-world buying habits. By combining these findings with market-wide figures, you sharpen your understanding of not just where you stand today, but where tomorrow’s gains or losses might come from.
Finding the right mix of data sources turns market share tracking from an educated guess into a precise science. Once you’re equipped with credible numbers, the real advantage lies in applying them strategically—whether it’s understanding your current position, or uncovering new ways to outsmart competitors.
Using Market Share Insights for Smarter Strategy
Benchmarking Performance Against Competitors
Effective use of market share data starts with honest benchmarking. Comparing your company’s share against main rivals reveals not just who is ahead, but by how much and why. Is your share rising while a competitor’s plateaus? Digging into these shifts uncovers moves that matter—such as a product revamp, a price drop, or the launch of a new service. Pay attention to the pace of change over time, not just a snapshot. Consistent benchmarking lets you track who is gaining ground and where your own advantages lie.
Spotting Opportunities for Growth or Defense
When you break your market share into regions, customer segments, or products, you’ll often spot openings invisible at the macro level. A small but growing foothold in one segment could signal where to direct investment. Conversely, a slip in share—especially in a previously strong area—alerts you to where competitors are making inroads. In mature markets, holding ground matters just as much as stealing share in new segments. Watch for subtle signals: shifts in customer preferences, or a rival’s increased marketing spend. These signs guide where to go on offense and where to reinforce your lines.
When to Re-Evaluate Your Approach
Markets rarely stand still. If your share measure doesn’t match what you see on the ground—unexpected sales dips, or sudden surges from a new entrant—it’s time to revisit your definitions and data sources. Growth in niche categories or the appearance of unconventional competitors can skew old benchmarks. Review market boundaries and competitors regularly to make sure your insights stay sharp. Adaptability is essential: the fastest-growing teams assess not just performance, but the tools and signals they use to measure it.
Once you master extracting strategic lessons from your share data, it’s critical to avoid the mistakes that can skew your view of the market. Next, we’ll look at the pitfalls that can creep in—and how to navigate around them for clearer insight.