
Equity Research Report: Structure, Purpose, and How to Read Them
If you’ve ever wondered how investors decide whether a stock is worth buying, holding, or selling, equity research reports are a big part of the answer. These reports break down a company’s financial health, business model, and prospects, providing insights from financial analysts that help both professionals and everyday investors make sense of complex market data. In fact, according to a survey by Refinitiv, over 90% of institutional investors rely on equity research in their investment process.
But equity research reports aren’t just for Wall Street insiders. Anyone can use them to better understand a company or industry—if you know how to read them. In this article, we’ll walk you through what equity research reports are, why they matter, what you can expect to find inside one, and how you can use them to inform your own investing decisions. Whether you’re just starting out, or looking to take your analysis to the next level, understanding these reports is a skill that pays off.
What Is an Equity Research Report?
Definition and Role in the Financial Markets
An equity research report is a written document that investigates a publicly traded company’s prospects. It blends analysis of a company’s finances, business strategy, and the industry it operates within. The goal is to estimate the company’s value and help readers decide whether buying or selling its shares makes sense. These reports play a key role in financial markets by clarifying complex financial information into actionable insights. Readers get a clearer picture of what drives a company, how it’s performing, and where it may be headed.

Equity research reports help level the playing field by providing professional analysis that would otherwise be hard for everyday investors to access or replicate. When markets are flooded with information and rumors, these reports can cut through the noise and highlight what truly matters.
Who Produces Equity Research Reports?
Most equity research reports come from financial institutions—especially investment banks and brokerage firms. Their in-house analysts examine companies within certain industries, publishing reports under the firm’s name. Independent research firms also produce these reports, often aiming to provide analysis free from investment banking relationships. Additionally, some reports are generated by buy-side firms for their own in-house use, though these are rarely shared publicly.
Regardless of where they originate, reports generally follow a structured approach. The analyst builds a case using both numbers and narrative, blending economics, interviews, market data, and forecasts. The finished product reflects a combination of detective work, number-crunching, and opinion—meant to inform decisions, not make them for you.
To truly understand these documents, it helps to get familiar with their typical structure and the purpose each section serves. Let’s step into the anatomy of a report and see how all the pieces fit together.
Why Equity Research Reports Matter
How Investors Use Research Reports
Equity research reports are not written for the sake of paperwork—they are the backbone of decision-making for institutional and retail investors alike. When a fund manager considers buying or selling a stock, an equity research report is often the first stop. These reports synthesize company data, market trends, competitor positioning, and future forecasts, turning mountains of scattered information into a navigable roadmap. Investors rely on them to uncover risks that aren’t obvious from company press releases or news coverage, and to spot opportunities the broader market may have missed.
Impacts on Stock Prices and Market Perceptions
Research reports do more than inform readers; they can move markets. When a high-profile analyst upgrades a stock or lowers its target price, trading volumes and prices often shift within hours. These documents shape market sentiment not just by providing facts and projections, but by framing the discussion around a company—highlighting certain catalysts, downplaying others, and sometimes introducing new thinking into the investor conversation.

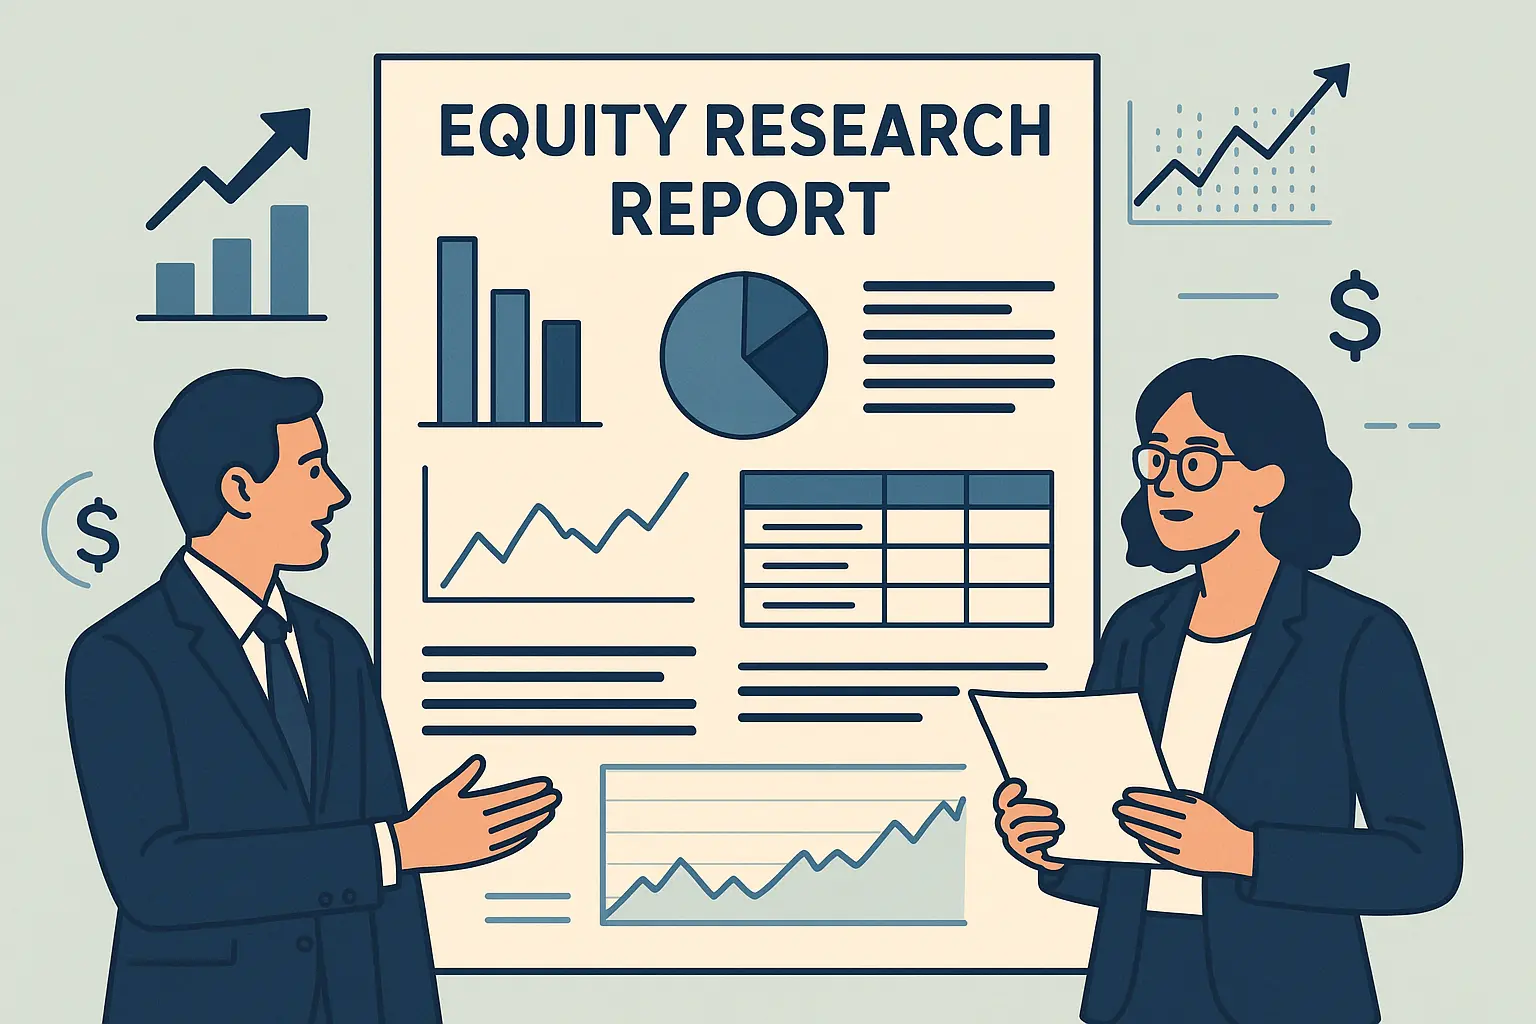
For example, the image above illustrates how a spike in trading activity often follows the release of a new report. This ripple effect can even impact peer companies or entire industry sectors, amplifying the importance of these reports beyond a single stock.
Understanding their influence and purpose is only the first step. To fully benefit from equity research reports, it helps to know their internal structure and what each section reveals about a company or its prospects. Let’s break down the components you’ll typically encounter.
Main Sections of an Equity Research Report
Executive Summary
The report opens with a concise summary, capturing the most significant findings and recommendations at a glance. This section distills the company’s outlook, key drivers, and crucial investment arguments into just a few paragraphs—perfect for readers who want the bottom line up front.
Company Overview and Industry Context
This section lays the foundation by introducing the company, its business model, and relevant background. Analysts detail how the company fits into its sector, outlining competitors, market position, and industry dynamics that may shape its future performance.
Financial Analysis and Key Metrics
Here, the report dives deep into the company’s numbers. Analysts examine revenue growth, profitability ratios, cash flow trends, and changes in the balance sheet. Charts commonly illustrate these trends, making complex data easier to digest and compare over time.

Valuation Methods Used
How much is the company really worth? This section outlines the models—like discounted cash flow (DCF), price-to-earnings, and sum-of-the-parts—that form the backbone of the analyst’s valuation. The reasoning behind the chosen methods is explained, allowing readers to understand the logic behind the numbers.
Investment Thesis
At the core of the report, this is where the analyst presents the argument for either buying, holding, or selling the stock. The thesis brings together financial insights, qualitative factors, and forward-looking statements, weaving them into a clear case for action or caution.
Catalysts and Risk Factors
Analysts flag upcoming events or developments—like product launches, regulatory decisions, or earnings calls—that could move the stock price. Just as importantly, they highlight potential downsides: competitive threats, market volatility, and company-specific concerns that could impact returns.
Analyst Rating and Price Target
Reports typically close with a clear rating—buy, hold, or sell—and an accompanying price target. These are derived from the analysis above and set realistic expectations for future stock performance over a defined time frame.
Understanding the structure of these reports is just the start. Next, we’ll explore how each type of report serves a unique purpose and how to spot the differences between them.
Types of Equity Research Reports
Equity research isn’t a one-size-fits-all process. Analysts tailor their reports to address different needs and moments in the market, resulting in several distinct types of research publications. Understanding the differences between these reports can help you home in on the insights that matter most, whether you’re curious about an unfamiliar stock or need clarity after a major company announcement.
Initiating Coverage
An initiating coverage report is the first deep-dive an analyst releases about a company. This report is comprehensive, giving readers a thorough introduction to the firm’s business model, industry position, financials, and growth outlook. It typically includes a fresh investment thesis and the analyst’s first official rating. Investors often turn to these when exploring new stocks, as they provide historical context and set the foundation for future analysis.
Earnings Update
Written after a company publishes its quarterly or annual results, earnings update reports focus on performance relative to market expectations. These reports dissect revenue, margins, and other key indicators, highlighting why numbers may have surprised or disappointed. The analyst explains what changed in their outlook and whether their target price or recommendation needs adjustment. For active traders and long-term investors, these updates are essential for recalibrating portfolio decisions.
Event-Driven Reports
Event-driven reports are released in response to significant developments outside the regular reporting schedule. This can include mergers, acquisitions, leadership changes, product launches, regulatory decisions, or market shocks. The analyst interprets the event, gauges its impact on the company’s prospects, and updates their stance if necessary. These timely analyses help investors respond quickly with informed action.
Each equity research report type delivers a unique perspective, but all share the same goal: clarifying what matters now. With these report formats in mind, let’s explore how research produced by different sides of the market reflects varying priorities and audiences.
Buy-Side vs Sell-Side Research
Key Differences
All equity research isn’t created equal. The key division? Buy-side and sell-side research. Sell-side reports, produced by investment banks and brokerages, are crafted for public consumption. Their purpose is to inform clients about stocks—in hopes clients will trade through their firm. This style often places a premium on clarity, timeliness, and broad market appeal. You’ll find specific recommendations (buy, hold, sell) and neatly packaged price targets.
On the flip side, buy-side research is an in-house resource for investment managers, such as hedge funds or pension funds. There’s no intent to sway external opinions or generate trading commissions. Instead, these reports dig deep into granular data, proprietary models, and long-term scenarios to serve just one client: the fund itself. Unlike sell-side reports, these usually skip public ratings, opting for nuanced, sometimes contrarian, conclusions.

How Each Type Informs Decision-Making
Sell-side research helps frame consensus: it gives investors a pulse on what the market is thinking, and the stories driving short-term sentiment. For those new to an industry or ticker, it’s a map of the landscape—complete with context, key metrics, and catalysts. However, because analysts might worry about maintaining relationships or pleasing clients, recommendations can be cautious or clustered around the consensus.
Buy-side research lives in the world of strategy and edge. These internal reports are built to challenge the market’s assumptions, dig deeper than the headlines, and uncover mispricings before the crowd. The aim is unique insight that translates into profitable trades—a competitive advantage in a noisy market. These can challenge sell-side opinions or ignore them altogether, focusing solely on what matters to the portfolio’s returns.
Recognizing these differences will help you read research reports more critically—knowing when you’re seeing surface-level commentary versus sharply focused, proprietary insight. With this in mind, let’s break down what actually goes into an equity research report and how to evaluate each part as you read.
How to Interpret and Use an Equity Research Report
What to Look For in the Analysis
Start by reading the executive summary and investment thesis. These sections outline the analyst’s main argument and predicted direction for the stock. Ask yourself: Is the thesis based on clear evidence and logical reasoning, or does it rely on guesswork and weak signals?
Dig into the financial analysis tables. Focus on revenue and earnings forecasts, as these drive most price targets. Compare these estimates with the company’s historical performance and current market conditions. Look at valuation techniques—such as price-to-earnings ratios or discounted cash flow models—and see how aggressive or conservative the assumptions are.
Pay close attention to the catalysts and risk factors. Is the analyst relying on specific upcoming events, such as a product launch or regulatory change? Are potential headwinds addressed clearly, or glossed over? This tells you where the analyst sees volatility ahead.

Check the rating and price target, but don’t treat them as gospel. Instead, view them as the end result of a chain of evidence. If you disagree with some inputs—like growth assumptions—you can recalculate your own implied value based on the report’s data.
Common Limitations and Biases
Even the most detailed report isn’t free from flaws. Analysts may face pressure to issue favorable ratings, especially if their firm has investment banking relationships with the company. Look for transparency: Does the report disclose such conflicts?
Forecasts are just educated guesses. Economic surprises, market corrections, and company-specific missteps can quickly make projections obsolete. Treat reports as living documents, not scripts to follow blindly.
Be aware of “herding”—where reports echo consensus views instead of challenging them. If every report you read gushes about the same stock, ask why divergent views are so scarce.
Once you’ve sharpened your interpretation skills, seeing a real equity research report in action can further clarify how all the moving parts come together.
Real-World Example of an Equity Research Report
To see how equity research reports come together in practice, let’s look at a simplified example based on a fictional company, “TechHaven Inc.” While actual reports run much longer and pack in more details, this sample highlights typical components and how they inform investment decisions.
Annotated Sample Sections
Executive Summary:
“TechHaven Inc. is rated Buy with a 12-month price target of $42. Growing demand for cloud-based services and successful product launches position the company for sustained revenue growth over the next year.”
Company Overview:
“Founded in 2010, TechHaven Inc. develops cybersecurity solutions for small and medium enterprises. The company operates primarily in North America and Europe, with over 5,000 B2B clients.”

Financial Analysis:
“In Q1, revenue grew 18% year-over-year to $220 million, driven by new subscriptions. Operating margin expanded to 24% from 19% last year due to higher licensing fees and disciplined cost management.”
Valuation:
“Using a discounted cash flow model, we estimate the stock’s intrinsic value at $41 per share. Comparative analysis with sector peers puts TechHaven’s forward P/E at 18x versus a peer average of 22x, indicating attractive relative value.”
Investment Thesis:
“We expect increased cybersecurity spending from mid-cap firms and improved product cross-selling to drive TechHaven’s double-digit top-line growth. The upcoming release of their AI-driven firewall could solidify their position in a crowded market.”
Risks:
“Key risks include competitive pressure from established players and slower-than-expected adoption of new products. Economic downturns could also delay enterprise software spending.”
Each section serves a clear purpose, allowing readers to track how analysts frame opportunities, evaluate financial results, and acknowledge the uncertainties ahead. Noticing how these elements fit together makes it easier to approach real reports with clarity and skepticism.
Of course, finding these reports can sometimes feel like a treasure hunt. Fortunately, several platforms, brokers, and even open sources make them more accessible than you might expect. Let’s explore the places where you can get your hands on quality research next.
Where to Find Equity Research Reports
Access via Brokers and Institutions
Many established brokerage firms, including Morgan Stanley, J.P. Morgan, and Goldman Sachs, produce in-house research reports. If you hold an account with one of these brokers, you’ll often have access to a curated library of research — sometimes as part of your account, sometimes for an extra fee. Reports are typically published on the broker’s secure platform, and can range from exhaustive sector overviews to quick, actionable updates following an earnings release.
Private banks and wealth management divisions of major financial institutions also share equity research with their clients. If you work with a financial advisor, it’s worth asking about access to these resources, which are often tailored for long-term investors.
Open Resources and Platforms
The growing push for transparency has made some equity research available beyond the walls of investment banks. Independent research providers like Seeking Alpha, Motley Fool, and Value Line share analysis and even full-scale research reports — though often with a delay compared to institutional subscribers. In some cases, these platforms crowdsource analysis, adding diversity but also variability in report quality.

Some stock exchanges, such as the London Stock Exchange and the Singapore Exchange, publish company research on their official websites. These often include summary research produced by independent analysts as part of market transparency initiatives.
Universities and public libraries occasionally offer access to databases like S&P Capital IQ, Morningstar Direct, or Bloomberg terminals, where equity research can be retrieved. Students and researchers can tap into a trove of professional-grade analysis that would otherwise require expensive subscriptions.
Knowing where to look is only half the journey. Once you have a report in front of you, making sense of its terminology and analysis can feel like cracking a secret code. Let’s break down the common questions that emerge once readers start interacting with real research reports.
Frequently Asked Questions
What exactly is in an equity research report?
An equity research report typically packs in a snapshot of a company—overview, financials, growth prospects, risks, and the analyst’s opinion (Buy, Hold, or Sell). Expect charts, model summaries, and a price target grounded in specific valuation methods.
Can individual investors access these reports for free?
Yes, sometimes. Major brokers release select reports to clients, and a few research houses put out highlights or summaries for public viewing. For full access, you often need an account with a brokerage, or you can look for platforms that offer independent research.
Why might two reports on the same company disagree?
Different analysts make different assumptions—about future growth, margins, or risks. Biases, research methods, and even timing (when the report was published) all influence conclusions and recommendations.
Are analyst ratings reliable?
They’re carefully considered, but not infallible. Analyst opinions reflect research and experience, but markets can move in unexpected ways, and every report is just one angle. It’s smart to treat reports as a starting point, not final word.
Do these reports ever get things seriously wrong?
Absolutely. Predicting company performance or market moves isn’t an exact science. Even seasoned analysts miss big developments, regulatory changes, or shifts in market sentiment.
How often do these reports get updated?
Updates range from quarterly (post-earnings) to whenever big news breaks: acquisitions, regulatory changes, or major shifts in company performance. Some stocks under heavy coverage will see frequent updates, others less so.
Curious how these ideas and opinions come to life in real research documents? Let’s walk through a concrete example to see how all these pieces fit together in practice.