
Ecommerce Metrics: The Data That Drives Growth
Think about the last time you shopped online. Your clicks, the items you left in your cart, and even how long you spent deciding—all of that became data. For ecommerce businesses, these small actions add up to powerful insights. In fact, according to Statista, global ecommerce sales reached over $5.7 trillion in 2022, and competition is fierce. Knowing which numbers matter can help stores grow, fix what’s not working, and create better experiences for shoppers.
But with so many numbers out there—conversion rates, bounce rates, average order values—it’s easy to feel lost. This post is here to cut through the noise. You’ll learn which ecommerce metrics truly drive growth, why they matter at each stage, and how to use them to make smart decisions for your store. Whether you’re a new business or looking to take your shop to the next level, understanding your data is the first step to real progress.
Understanding Ecommerce Metrics vs. KPIs
What is an Ecommerce Metric?
An ecommerce metric is a specific value you measure, like website traffic, average order value, or the number of new customers in a given month. Metrics simply track what’s happening in your online store—the raw numbers that show activity. They reflect everything from how visitors interact with your site to how efficiently your business operates.
What Is a KPI? How Are They Different?
KPI stands for Key Performance Indicator. KPIs are the metrics you decide mater most for reaching your business goals. If metrics are every bit of data you can collect, KPIs are the handful you put front and center on your dashboard, because hitting them signals you’re on track. For example, monitoring sessions is a metric; setting a KPI like “increase conversion rate to 4% in Q2” turns that measurement into a benchmark for success.
In other words, all KPIs are metrics, but not all metrics are KPIs. The difference is intent: KPIs tie directly to your ecommerce targets, helping you prioritize action rather than just watching numbers rise and fall.
Now that you know the difference, let’s see why understanding both is vital at every step of your customer’s journey—starting from the first visit.
Why Ecommerce Metrics Matter at Every Stage
From Traffic to Loyalty: The Customer Journey
Every visitor who lands on your store begins a journey: discovery, consideration, purchase, and—if you’re strategic—loyalty. At each step, the numbers tell a story. Tracking how many people visit, how many add to cart, who actually buys, and which customers come back for more helps you pinpoint exactly where your experience delights—or disappoints.
For example, a sudden spike in traffic with no boost in sales may point to a disconnect between your messaging and your offer. A dip in returning customers can hint at post-purchase friction or unmet expectations. With metrics, you’re not guessing—you’re seeing, stage by stage, how users move and where they stall.
How Metrics Reveal Bottlenecks and Opportunities
Patterns in your ecommerce data work like maps, highlighting not just successes but also sticking points—pages where carts are abandoned, or traffic that never translates into checkouts. These aren’t just numbers; they’re signals. High exit rates on shipping pages might mean your fees are scaring off buyers. Fast-growing sales from a niche ad campaign could reveal an untapped market.
By looking at the right metrics during each phase—awareness, consideration, conversion, retention—you can demystify the customer experience. This knowledge enables you to fix leaks, double down on what works, and refine your approach as your business grows.
But which ecommerce numbers truly matter, and how do you track them in a way that turns information into action? Let’s break down the essential data points that can move the needle for your store’s success.
Essential Ecommerce Metrics to Track
1. Conversion Rate
Conversion rate reveals the percentage of site visitors who complete a desired action—often a purchase. Knowing this number shows you how well your store persuades browsers to become buyers. Identify where people drop off in your funnel to turn leaks into wins.
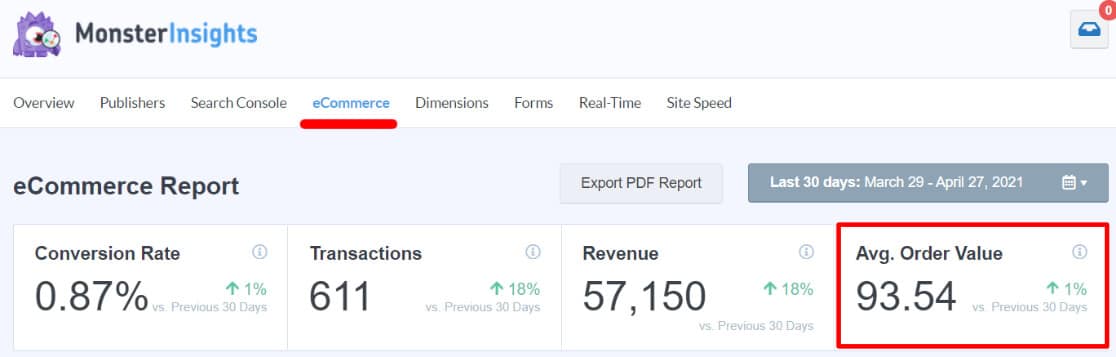
2. Average Order Value (AOV)
AOV tells you the average amount spent each time someone places an order. A higher AOV means customers buy more per transaction, giving you greater revenue without needing more shoppers. Experiment with bundling and upselling to nudge this metric upward.
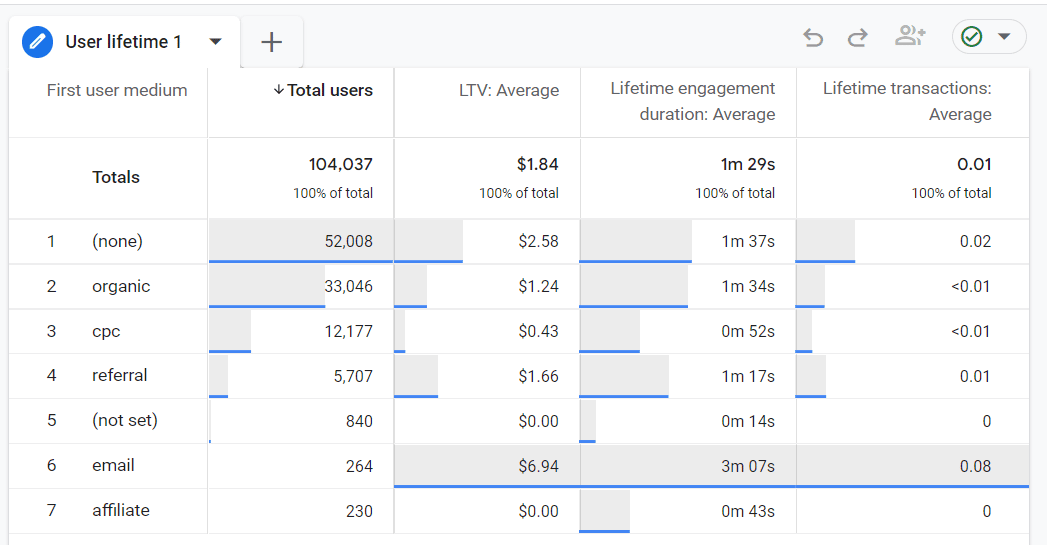
3. Customer Lifetime Value (CLV)
CLV estimates how much total revenue you expect to earn from a customer throughout your business relationship. The higher the number, the healthier your growth prospects. Prioritize loyal shoppers and upselling to maximize CLV for long-term payoff.
4. Customer Retention Rate
This metric tracks the percentage of customers who return to buy again within a specific period. Strong retention cuts your reliance on constant new customer acquisition and boosts profitability.
5. Customer Acquisition Cost (CAC)
CAC measures how much you spend to win a new customer—think ads, influencer deals, and email campaigns. Keeping CAC lower than CLV is non-negotiable if you want a sustainable ecommerce business.
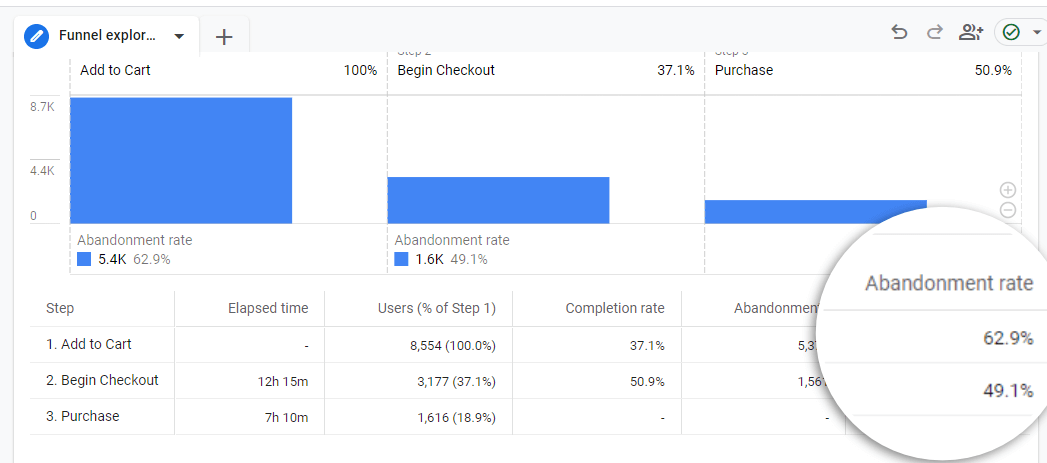
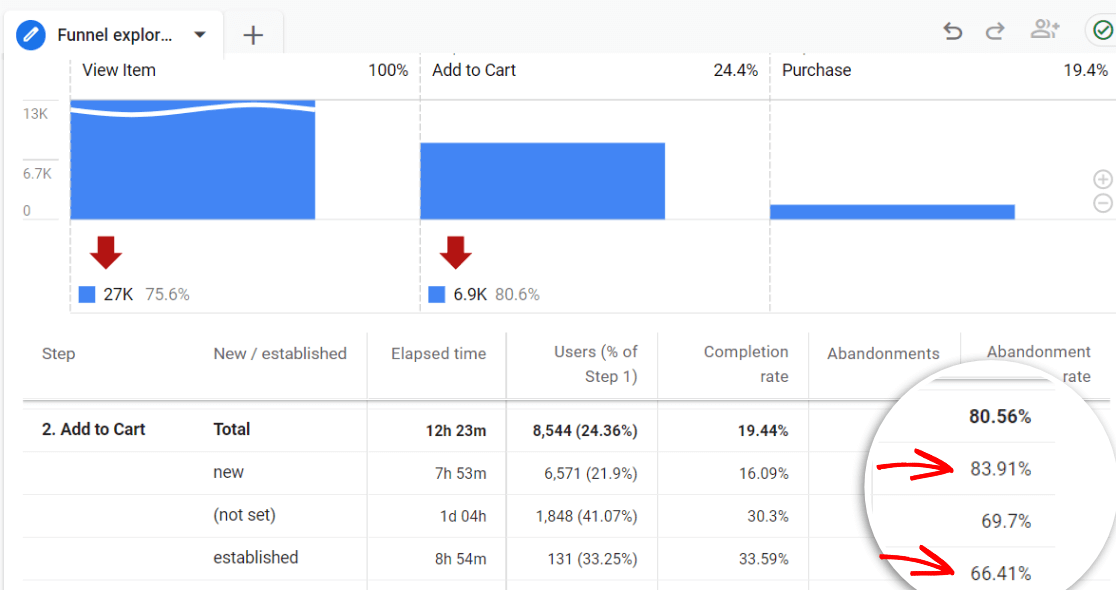
6. Shopping Cart Abandonment Rate
Discover the percentage of shoppers who put items in their cart but walk away before completing checkout. High abandonment rates are clues: Are hidden fees scaring folks off, or is your checkout just too clunky?
7. Refund and Return Rate
Not every sale is forever. Tracking refund and return rates exposes underlying issues—maybe with product quality, descriptions, or customer expectations. Reducing this number saves revenue—and headaches.
8. Bounce Rate
Bounce rate measures site visitors who leave after seeing just one page. High bounce rates may mean your landing pages miss the mark or your targeting is off. It’s a signal to get curious about first impressions.
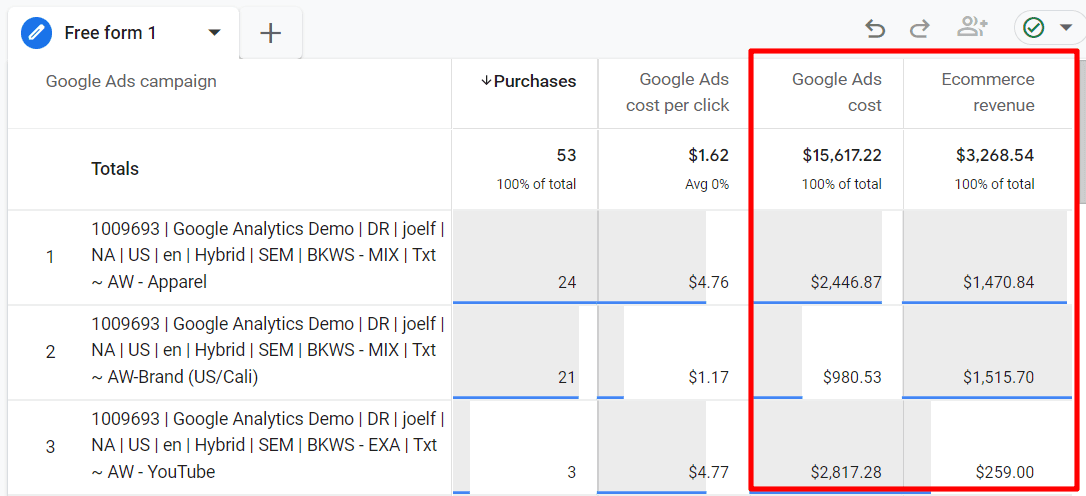
9. Traffic by Source & Device
Knowing where your visitors come from—be it search, social, or email—and which devices they use, helps you focus your marketing where it matters. Optimize the experience for your most popular channels and screens.
10. Net Promoter Score (NPS) & Customer Satisfaction (CSAT)
These two gauges measure how likely your customers are to recommend your store and their satisfaction after purchases. Positive scores signal healthy relationships, while dips point to areas for improvement.
Each of these metrics gives you a new lens on your store’s performance—when you connect them, they tell the full story. Before you dive into every number, it’s smart to focus on the ones that make the biggest impact for your stage and goals. Let’s look at how to pick the right metrics for your next strategic leap.
Choosing the Right Metrics for Your Store
Match Metrics to Your Growth Stage
Picking metrics is not a one-size-fits-all task. If your store just launched, zeroing in on traffic, bounce rate, and customer acquisition cost gives you a pulse on visibility and early conversions. As sales grow, tracking repeat purchase rate, average order value, and customer lifetime value tells you if the foundation of loyalty and profitability is sturdy. A mature store, on the other hand, benefits most from monitoring retention, refund rates, and net promoter scores, so any leaks in your growth bucket are quickly found and fixed.
Metrics for Retention vs. Metrics for Acquisition
Want more shoppers, or more returning customers? The answer changes the numbers to watch. If expansion is your focus, metrics like channel-specific traffic, conversion rate, and CAC are your best friends. You’ll see where people come from, what hooks them, and how much you pay for each. If you’re aiming to keep past buyers coming back, dig into retention rates, CLV, purchase frequency, and refund statistics. This data reveals how effective your post-purchase experience is and helps refine loyalty programs or win-back campaigns.
Finding the right mix of numbers to track isn’t about volume—it’s about focus. As your business shifts direction, so should your dashboard. Keeping metrics aligned with your actual goals turns data from background noise into a practical growth tool.
Of course, knowing what to track is step one. But how often should you be checking these numbers? Let’s break that down next, so you never miss an opportunity or warning sign as it happens.
How Often Should You Check Ecommerce Metrics?
Daily and Weekly Metrics
Some metrics move fast enough that daily or weekly check-ins keep you close to the pulse. Daily essentials include total sales, transaction volume, and site uptime—these numbers catch red flags before they snowball. Weekly dashboards should highlight conversion rates, ad performance, cart abandonment, and traffic by channel. A spike in abandoned carts or a sudden drop in paid traffic deserves attention now, not next month.
Monthly and Quarterly Metrics
Not every stat is worth obsessing over daily. Deeper numbers—like Average Order Value, Customer Lifetime Value, and Customer Retention Rate—show their real value over longer runs. Look at these every month or quarter, which helps you spot patterns, measure marketing campaigns, and see if your loyalty strategy is really working. This cadence also gives breathing room for strategic decisions that need time to mature.
Most ecommerce stores thrive with a rhythm: check vital signs every day, take the store’s temperature every week, and diagnose its health every month. This approach keeps you alert to surprises without burning out on data overload.
What makes metric tracking powerful isn’t just the habit, but how you act on what you learn. So, once you know when to check your numbers, how do you actually use them to boost growth? Let’s dig into that next.
How to Use Data to Improve Results
Spotting Trends & Acting on Insights
Start by comparing recent data with past performance. Look for significant changes—spikes in conversion rate after a promotion, or a sudden dip in average order value. Patterns like these are your signal to dig deeper. For example, if you notice increased traffic from Instagram but low conversions on that traffic, it’s a cue to refine your Instagram strategy or adjust your landing pages.
Try segmenting your data. Instead of looking only at topline numbers, break metrics out by channel, device, or customer cohort. This turns broad trends into targeted clues. Maybe mobile shoppers on weekends abandon carts more often, or return rates are higher on a specific category—each pattern points you toward a specific action.
A/B Testing and Experimentation
When you spot a possible improvement, don’t just guess—test it. A/B testing allows you to serve two different versions of a page or feature to see which performs better. Change one variable at a time: try a new product photo on your bestseller, tweak your checkout button color, or rewrite your value proposition. Measure how each change affects your chosen metric, and roll out improvements that demonstrably increase revenue, engagement, or retention.
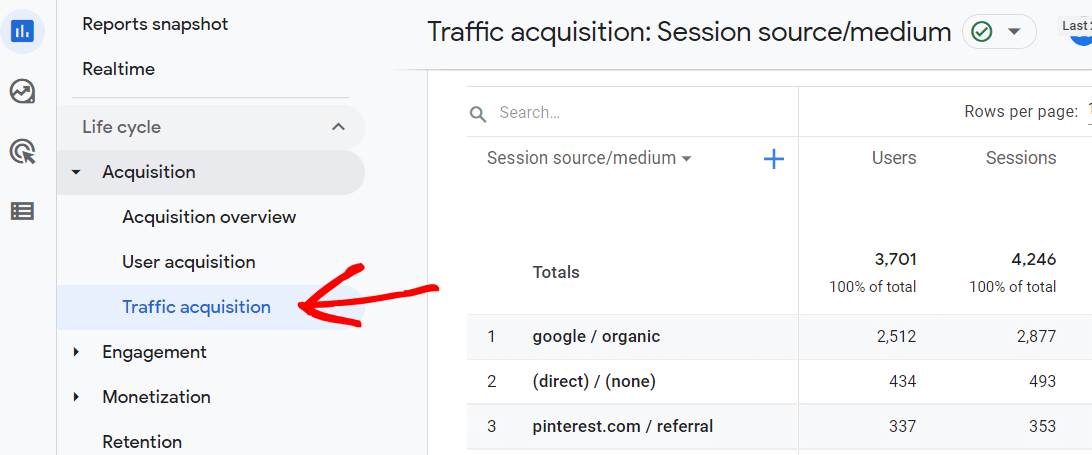
Dashboards and Reporting Tools for Ecommerce
To stay on top of your numbers without drowning in spreadsheets, use dashboards tailored for ecommerce. Platforms like Google Analytics, Shopify’s built-in reports, or plugins like MonsterInsights let you view trends for important metrics at a glance. Automated reporting tools can deliver regular updates direct to your inbox so you can track shifts without constantly logging in.
Data isn’t just about monitoring what happened—it’s about uncovering what to do next. With the right setup, each insight can spark questions, experiments, and quick action. Now that you know how to interpret and apply your metrics, it’s time to clear up common uncertainties and misconceptions that could be muddying your approach.
Ecommerce Metrics FAQ
Which Metric Matters Most?
No single metric rules them all—what’s most important depends on your store’s goals and challenges. If you’re new and struggling to turn visits into sales, focus on conversion rate. If your customer base is growing, shift to retention and lifetime value. Ultimately, impact comes from understanding your current stage and digging into the metric that directly ties to your next leap in growth.
Best Tools to Track Ecommerce Metrics
You don’t need an army of analysts—just pick the right tools. Google Analytics is a classic for tracking site traffic, funnels, and goals. For detailed ecommerce data, try platforms like Shopify Analytics, WooCommerce Reports, or third-party tools such as MonsterInsights and Klaviyo. Want everything in one place? Consider dashboards like Databox or Looker Studio (formerly Google Data Studio) to blend your metrics beautifully.
What Metrics Should New Stores Prioritize?
Start simple. Focus on conversion rate, average order value, and traffic sources—these tell you how many visitors buy, how much they spend, and where they come from. This trio helps you spot leaks, double down on what’s working, and avoid drowning in data noise before you have consistent sales.
Once you’re comfortable with the basics, it’s time to dig deeper into how you can take action on your metrics—improving results through smart testing and targeted changes.