
Bottom Up Market Sizing: Step-by-Step Approach for Reliable Forecasts

How big is your market, really? It’s a simple question, but the answer can drive everything from your budget to your hiring plans. And yet, 55% of startups fail because they misjudge market demand. One common reason: relying on vague, top-down estimates instead of digging into real data.
That’s where bottom up market sizing comes in. Unlike broad industry guesses, the bottom up approach starts with specifics: actual potential customers, what they’ll pay, and how many you can realistically reach. This method is widely used by investors and successful companies alike because it builds your forecast with real, testable numbers.
If you’re wondering how to approach market sizing in a way that’s accurate (and convincing to others), this step-by-step guide will walk you through the process—helping you avoid common pitfalls and create a forecast you can trust.
Understanding Bottom Up Market Sizing
Bottom up market sizing is an analytical approach that builds market forecasts from the ground up, focusing on real, actionable data points—such as the number of prospective customers and the revenue you can realistically earn from them. Unlike broad, aspirational estimates, this method emphasizes rigor and clarity, making it invaluable for businesses seeking credible market projections.
How Bottom Up Differs from Top Down
Top down market sizing starts with a large, often global, market figure and then narrows it down through assumptions or percentages. In contrast, bottom up market sizing begins with the actual target customers you can reach and the revenue each can generate for your business. This fundamental difference means bottom up analysis is grounded in tangible data, offering more nuanced, realistic, and defensible results—especially valuable for new or niche businesses with unique customer dynamics.
When to Use Bottom Up Market Sizing
The bottom up approach is best used when you require an accurate reflection of your actual market opportunity—particularly in emerging industries, new markets, or when launching disruptive products. It’s ideal for startups, innovative SaaS providers, or businesses entering unfamiliar geographies, where relying solely on broad industry stats won’t capture your real addressable market. Investors and stakeholders often trust bottom up sizing for its evidence-based numbers and transparent methodology.
Now that you understand the unique advantages and strategic importance of bottom up market sizing, it’s time to break down its essential components—starting with how to identify the right customer segments for your analysis.
Core Elements of a Bottom Up Calculation
Identifying Target Customer Segments
The foundation of a robust bottom up market sizing exercise is a clear definition of the target customer segments. By segmenting your market, you focus on the specific profiles of customers most likely to buy your solution, such as by industry, geography, company size, or behavioral criteria. This segmentation ensures your calculations are grounded in relevant, actionable customer groups rather than broad, generalized populations.
Estimating Potential Customer Numbers
Once your segments are defined, quantifying the total number of potential customers within each group is crucial. Start with the most granular data available, like business registries, industry association reports, census data, or proprietary databases. The accuracy of this step directly impacts the reliability of your forecast, so leverage primary research or recent secondary data whenever possible.
Determining Average Revenue per Customer
The last core element is establishing the average revenue you can realistically expect from a typical customer in each segment. This figure—sometimes called ARPU (Average Revenue Per User)—may vary based on factors such as pricing models, purchase frequency, contract size, product mix, or adoption rates within segments. Realistic expectations here come from a mix of historical data, pilot programs, and competitive benchmarks.
By bringing together well-defined customer segments, accurate counts of target customers, and justified revenue assumptions, you lay the groundwork for a believable and actionable bottom up market estimate. With these core elements in place, you’re now ready to walk through the actual calculation process, applying these inputs to determine the true size of your opportunity.
Calculating Your Bottom Up Market Size
Multiplying Customer Numbers by Revenue
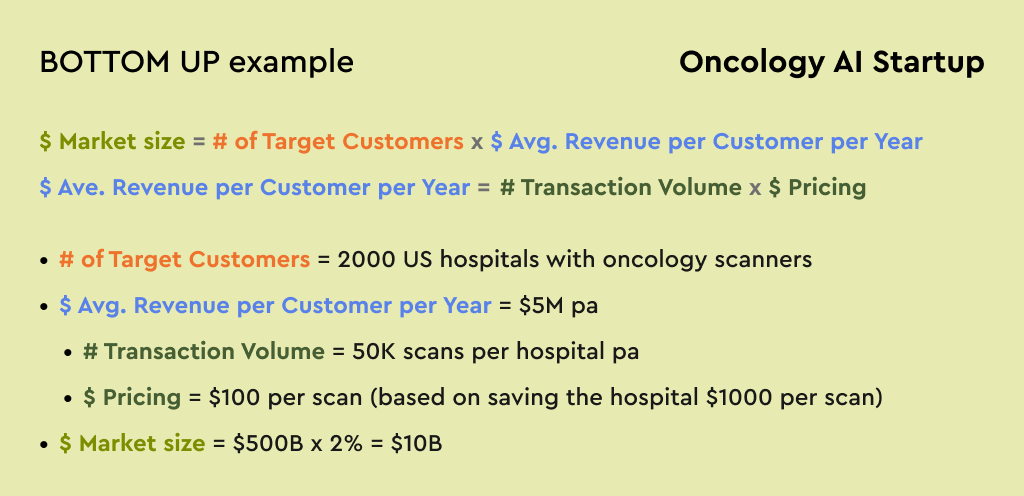
Once you’ve identified your target customer segments and estimated both the number of potential customers and the average revenue per customer, the core formula of bottom up market sizing comes into play. Simply put, you multiply the estimated number of customers by the average revenue per customer for each segment. This gives you a straightforward calculation of revenue opportunity per segment.

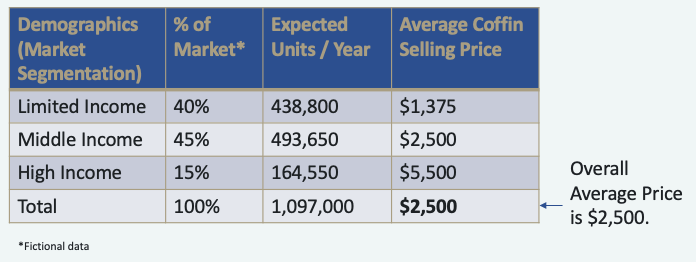
Aggregating Across Segments
Rarely does your product or service appeal to a single, homogeneous group. To capture the most accurate market size, perform the above calculation for each of your identified customer segments. Then, aggregate the totals across all segments to determine your comprehensive bottom up market size. This approach not only increases accuracy but also helps surface which customer types represent the largest opportunities—and potential risks.
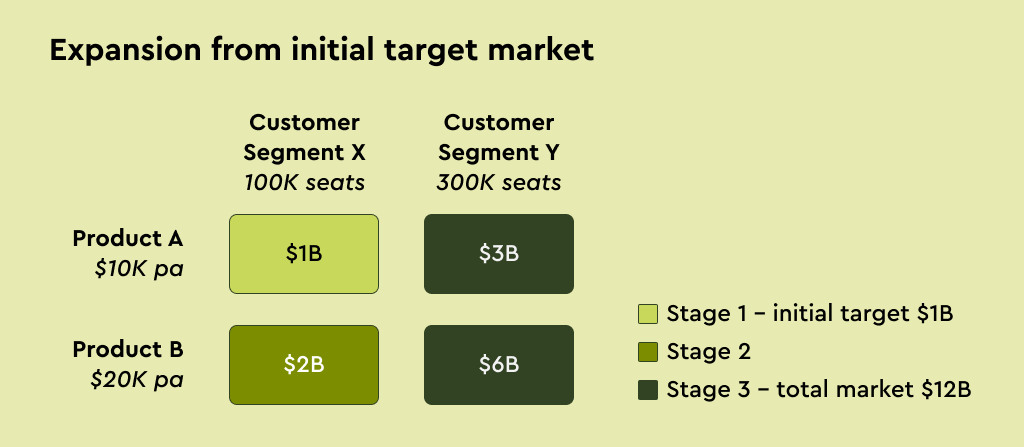
Adjusting for Market Penetration
The initial calculation typically assumes 100% market penetration, which is rarely realistic. To fine-tune your forecast, estimate the percentage of the addressable market you can realistically capture over your planning horizon. Factors such as competitive landscape, distribution reach, regulatory restrictions, and product adoption rates come into play here. Apply this percentage as a multiplier to your total market size, resulting in a more credible, actionable figure for your business or investment decisions.
With a robust bottom up calculation in place, the next crucial step is to ensure the reliability of your results by validating them against external benchmarks and testing their resilience under different scenarios. Let’s explore how to do just that.
Validating and Stress Testing Your Results
Cross-Checking Against External Data
After generating your bottom up market sizing estimate, it is crucial to validate your figures against reputable external data sources. Cross-referencing with industry reports, government statistics, competitor disclosures, and analyst forecasts can help you spot discrepancies or over-optimism in your calculations. If your results stray significantly from established benchmarks, investigate the root causes—this step not only uncovers possible flaws, but also strengthens your confidence in the findings if they align.
Sensitivity Checks and Scenario Analysis
Validation doesn’t stop at external comparisons. Perform stress testing by running sensitivity analyses on key assumptions, such as total addressable customers or average revenue per user. Adjust your model inputs—optimistic, base case, and pessimistic scenarios—and observe how much they impact your overall market size forecast. Such scenario analysis reveals whether your estimate is robust or unduly sensitive to minor changes, helping frame a more realistic range for strategic planning.
Thoughtful validation and stress testing not only provide added credibility but also guide better business decisions by clarifying the reliability of your estimates. Now that your market size calculation has been rigorously tested, let’s explore how these methodologies apply to real-world examples, illustrating their impact in actual business scenarios.
Real-World Example: Bottom Up Market Sizing in Action
Breaking Down a Simple Case Study
To bring the theoretical steps to life, let’s consider a SaaS startup aiming to serve independent fitness trainers in the United States. The goal is to estimate the startup’s annual addressable market using a bottom-up approach.
First, the team identifies its target segment: certified, independent fitness trainers who operate outside of gyms and chains. Through industry databases and associations, they estimate there are about 100,000 such trainers in the country.
Next, they conduct surveys and interviews, finding that their software’s core features are valued at $500 per year per trainer. This figure reflects the typical budget and willingness to pay within their segment, ensuring accuracy and excluding inflated assumptions.
With these pieces in place, the bottom up calculation is straightforward:
Market Size = Number of Potential Customers × Average Revenue per Customer
Market Size = 100,000 trainers × $500 = $50 million annually.
To further refine this estimate, the team accounts for expected adoption rates in the first year, forecasting a 10% market penetration. This means their realistic, first-year obtainable market is $5 million, not the full $50 million theoretical maximum.
This example highlights how bottom-up sizing builds a credible, data-driven market estimate grounded in real customer and pricing information.
Lessons Learned and Takeaways
In this case, the accuracy of the market sizing depends on careful segment identification, robust customer number estimation, and realistic revenue assumptions. By starting with ground-level data, the startup avoids overestimation risks commonly found in top-down sizing and builds a strong foundation for business planning and investor communications.
Ultimately, bottom-up market sizing not only helps forecast potential revenue but also sharpens go-to-market strategies and resource allocation by shining a light on where real opportunities lie.
Having explored a practical application, it’s just as essential to ensure your calculations hold up under scrutiny. Next, we’ll dive into how you can validate, cross-check, and stress test your bottom-up market sizing to ensure your forecasts remain robust and reliable.