
Internal Rate of Return Calculation: Methods, Examples, and Practical Uses
Have you ever wondered how investors decide if a project or investment is really worth their money? One of the most widely-used tools for making these decisions is the Internal Rate of Return, or IRR. In fact, a survey by the Global Corporate Finance Society found that over 75% of finance professionals consider IRR their preferred metric for comparing investment opportunities. It’s a simple idea with a big impact: IRR tells you the annual rate of growth an investment is expected to generate, letting you compare everything from real estate deals to business projects on equal terms.
But calculating IRR isn’t always as straightforward as it sounds, and knowing how to interpret the results can help you avoid costly mistakes. In this guide, we’ll break down the different methods for finding IRR, walk through step-by-step examples, and look at where IRR really helps in practical decision-making. Whether you’re a student learning the basics, or someone looking to make smarter investment choices, understanding IRR can give you a clearer picture of your potential returns—and your risks.
What is Internal Rate of Return (IRR)?
Key concepts behind IRR
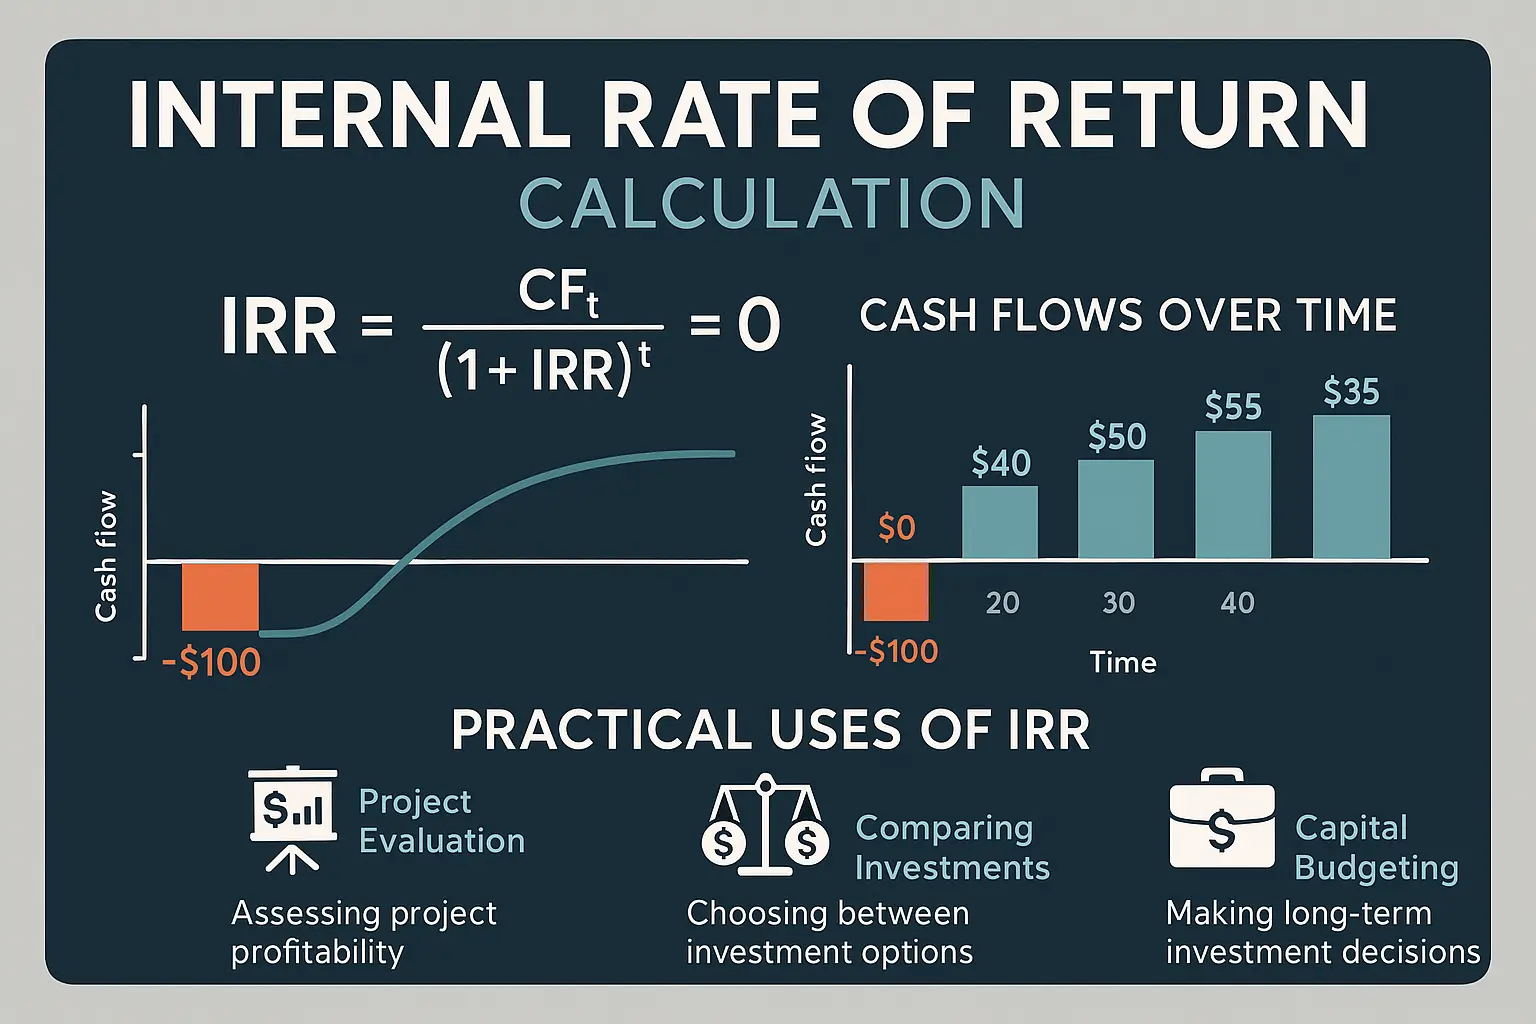
Internal Rate of Return (IRR) measures the annualized percentage return earned on an investment, assuming all cash flows are reinvested at this rate. Put simply, IRR is the discount rate that makes the sum of future cash flows from a project equal to its initial cost—meaning, it’s the rate where the net present value (NPV) of investment cash flows is zero.
The IRR calculation focuses on timing and size of incoming and outgoing cash flows, capturing the effect of how much you invest, when you invest it, and how quickly you recover your capital. Because IRR uses the project’s individual cash flows rather than broad market assumptions, it’s inherently tailored to each investment scenario—and easily comparable across opportunities with different durations and scales.
Why IRR matters in investment decisions
IRR offers a clear snapshot of an investment’s earning power, allowing you to benchmark opportunities regardless of their time frames or amounts. If a project’s IRR is higher than other available investment options or exceeds borrowing rates, it signals a potentially attractive use of capital. Conversely, a low IRR may prompt reconsideration or negotiation for better terms.
Businesses and investors rely on IRR to help identify projects likely to generate value beyond their costs. It filters out investments that look profitable on paper but fail to deliver sufficient returns when timing and risk are considered.
Before diving into how IRR is actually calculated, let’s explore the underlying formula and steps involved in finding this powerful metric.
Breaking Down the Internal Rate of Return Calculation
IRR formula explained
The internal rate of return (IRR) finds the discount rate that sets the net present value (NPV) of all future cash flows from a project or investment to exactly zero. In mathematical terms, the IRR is the rate where:
The formula looks like this:
NPV = 0 = ∑t=0N [ Ct / (1+IRR)t ]
Where Ct is the cash flow at time t, and N is the total number of periods. IRR is the unknown in this equation, solved by finding the rate that balances incoming and outgoing cash flows over time.
Step-by-step calculation process
Finding IRR typically means a bit of trial and error, because the formula can’t be rearranged to directly solve for IRR. Instead, the process involves plugging in various rates until the NPV equals zero. Here’s how you tackle it:
1. Lay out all expected cash flows, both outflows and inflows, over each period.
2. Choose a discount rate and calculate NPV. If NPV isn’t zero, adjust the rate up or down and try again.
3. Repeat until you home in on the discount rate that brings NPV as close to zero as possible. This is your IRR.
While this can be done manually, it’s much faster with spreadsheets or financial calculators—but understanding the core process sharpens your intuition for how IRR reflects the time value of money and the risk profile of your investment.
Now that you know what IRR is and how it’s calculated, let’s see how these calculations play out using different tools, and discover why spreadsheets have become the investor’s shortcut for nailing down IRR with confidence.
Manual vs. Spreadsheet Methods for Calculating IRR
Trial and error calculation
Calculating IRR by hand involves an iterative process. You start by making an educated guess at the discount rate that will bring the net present value (NPV) of your investment’s cash flows to zero. Then, you adjust your rate higher or lower and recalculate NPV, repeating the process until the NPV hovers as close to zero as possible. This is why IRR calculations were historically considered tedious and best suited for those comfortable with math and a scientific calculator.
Here’s how it works in practice: write down all expected cash flows, including the initial outlay (as a negative number) followed by inflows for each period. Substitute different rates into the NPV formula until the total approaches zero. Because IRR is not solvable by rearranging the equation directly, each new rate gets you closer to the exact answer. This approach is accurate but can be time-consuming, especially for projects with uneven, long-term cash flows.
How to use Excel or Google Sheets for IRR
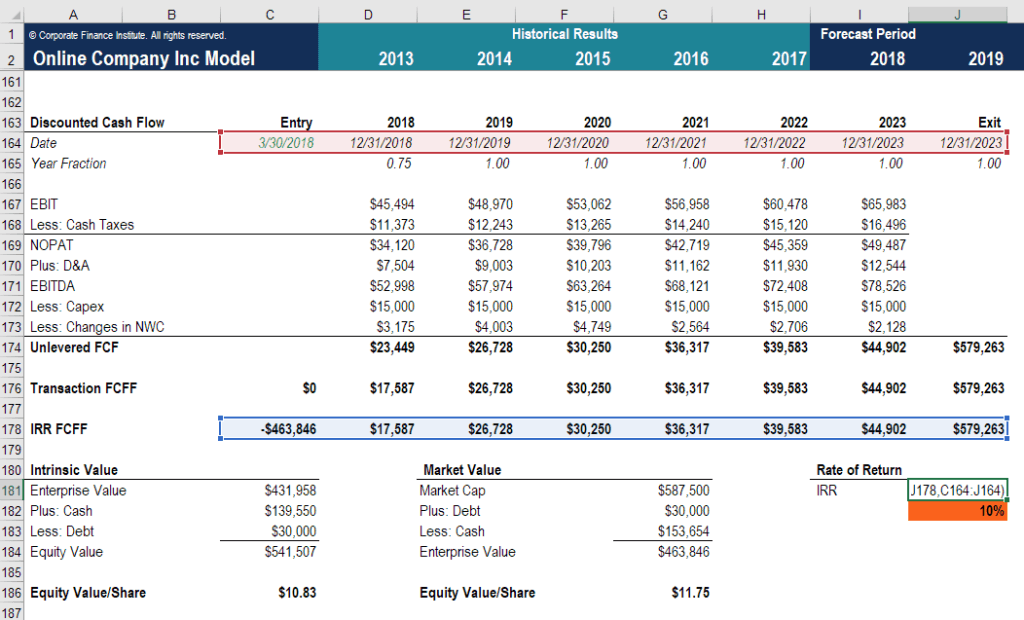
Spreadsheets take the grind out of IRR calculations. In Excel or Google Sheets, the =IRR() function handles the iterative math for you. Simply enter your cash flows in consecutive cells—starting with the initial investment, then each period’s returns. Select these cells and feed them into the =IRR() formula. The spreadsheet instantly returns the internal rate of return, saving you countless recalculations.
Excel and Google Sheets also let you specify a “guess” for the IRR, which can speed up calculations for complex cash flow patterns. This method not only makes things faster, but also less prone to manual error. For more nuanced analyses, tools like =XIRR() accommodate irregularly timed cash flows, expanding the method’s flexibility beyond what’s practical by hand.
Understanding both approaches helps you appreciate how spreadsheets deliver accuracy and efficiency with a single formula. However, knowing the trial-and-error roots of IRR highlights why it remains an essential—but sometimes misunderstood—metric. Now that you’ve seen the practicalities behind the math, let’s look at how those results actually inform your financial decisions.
Interpreting IRR Results: What Does Your Calculation Tell You?
Once you’ve found your project’s internal rate of return, the next step is to understand its meaning. The IRR presents a single percentage that expresses the effective annual rate a project earns on invested capital, accounting for all cash inflows and outflows. But without context, this number means little. Its true value emerges when you examine it next to your specific investment benchmarks.
Comparing IRR to hurdle rates and WACC
IRR’s most common use is in comparison: specifically, how it measures up against your project’s “hurdle rate” or the company’s weighted average cost of capital (WACC). The hurdle rate is the minimum acceptable return for an investment. WACC reflects the company’s blended cost of raising funds, considering both debt and equity. If a project’s IRR exceeds the hurdle rate or WACC, it suggests the investment could generate value for the business. If IRR falls short, the investment may not compensate for risk and financing costs, and is usually less attractive.
For example, if your business’s WACC is 8% and a project’s IRR comes in at 12%, this points to a project worth pursuing—the return outpaces the cost of capital. But if another project’s IRR is only 6%, it’s likely not worth the risk compared to alternative opportunities or simply parking the funds elsewhere.
Additionally, comparing IRR allows you to prioritize between competing projects, focusing capital on those that offer the best proportional returns after covering their risks and funding costs.
But there’s a caveat: high IRRs can sometimes result from projects with early large inflows followed by cash outflows, or from unconventional cash flow patterns. That’s why it’s crucial not just to accept a high IRR at face value, but to look at the details of the investment’s structure and timing.
Now that you understand how to frame IRR results against decision benchmarks, let’s see how these principles work in specific, real-world investment scenarios.
Thank you for reading EasyVC’s blog!
Are you looking for investors for your startup?
Try EasyVC for free and automate your investor outreach through portfolio founders!
Ready to put IRR theory into practice? The best way to master internal rate of return calculations is by diving into actual examples and working through the numbers yourself. Whether you’re trying to gauge the potential of a new investment or are brushing up on your financial modeling, it’s real scenarios that bring the formulas to life.
Let’s see IRR in action with some straightforward investment scenarios—and discover what happens when cash flows aren’t so predictable.
Real-World IRR Calculation Examples
Simple investment scenario
Let’s say you invest $10,000 in a project, hoping it pays back over three years. The project returns $4,000 in year one, $4,000 in year two, and $4,000 in year three. To find the internal rate of return, you’re figuring out the annual interest rate that sets the net present value (NPV) of these cash flows to zero.

By plugging the numbers into a financial calculator or spreadsheet, you’ll see the IRR lands around 9.7%. This means the investment is essentially generating a 9.7% annual return. If your minimum required rate of return—or hurdle rate—is lower than 9.7%, this project likely makes sense on paper.
Unconventional cash flows and multiple IRRs
Now, let’s examine a trickier case: a mining project with uneven inflows and outflows. Suppose you invest $20,000 upfront, receive $50,000 in year one, but face an unexpected $35,000 cleanup cost in year two (so, a negative outflow after the initial investment).
In this scenario, the project has two sign changes in cash flow (negative-positive-negative), which means you might encounter multiple IRRs. When running the numbers, you could get two different rates that set the NPV to zero—say, one at 10% and another at 29%. This can be confusing, as the project’s viability depends on which rate more accurately reflects the nature of returns among your investment alternatives. Recognizing these cases is important; multiple IRRs can cloud your decision if you rely only on the IRR calculation without looking deeper.
With these examples in mind, you’ll see how practical IRR calculation can guide—yet sometimes complicate—decision making. Next, let’s consider another approach for projects with cash flows that don’t fit the classic mold, ensuring your investment analysis doesn’t hit a dead end when IRR alone can’t reveal the full picture.
Modified Internal Rate of Return (MIRR) and Other Alternatives
When to use MIRR over IRR
Traditional IRR can become confusing when projects have unconventional cash flows—such as those that alternate between positive and negative amounts. In these cases, IRR may deliver multiple, conflicting results. The Modified Internal Rate of Return (MIRR) addresses this by assuming all project costs are financed at the firm’s cost of capital and that all intermediate cash inflows are reinvested at a safe, realistic rate. MIRR removes the problem of multiple IRRs and gives a single, more practical rate of return, making it much more reliable when analyzing projects with erratic or non-standard cash flow patterns.
Other performance measures to consider
While IRR and MIRR are valuable metrics, they don’t tell the whole story. Net Present Value (NPV) is widely regarded for its ability to express value in dollar terms, showing exactly what a project contributes in today’s money. Payback period, though simpler, helps gauge how quickly an investment can recoup its initial outlay, but it ignores returns after payback. For capital budgeting decisions, profitability index and discounted payback period can offer additional insight, especially when comparing projects of different sizes or with varying levels of risk.
These alternatives help investors see the bigger picture, balancing out rate-based metrics with value and risk considerations. Next, let’s look at how relying entirely on IRR can introduce its own set of challenges—and how to avoid the most common missteps in return calculations.
Common Limitations and Mistakes in IRR Calculation
Cash flow timing issues
IRR assumes that all periods between cash flows are equal and that cash flows always occur at perfectly regular intervals—usually at the end of each year. If cash flows are not consistently timed, the calculated IRR can be misleading. For example, if a project generates a return six months after the initial investment, treating it as a year can both overstate or understate profitability. This can cause investors to misjudge project attractiveness, especially when comparing projects with irregular or unsynchronized cash flows.
Pitfalls of multiple IRRs
Projects with unconventional cash flows—meaning the series of inflows and outflows change direction more than once—can generate more than one IRR value. For example, an initial investment followed by a few years of positive returns, and then a substantial outflow for repairs, will lead to multiple mathematically valid IRRs. Relying solely on the IRR in these scenarios can leave you confused or lead to poor decisions, as there is no way to determine which IRR is the “right” one without further analysis.
Recognizing these limitations highlights the importance of using complementary methods and being cautious with interpretation. Up next, you’ll see how these concepts play out through real investment scenarios—demonstrating both straightforward and tricky cases for IRR calculation.
Frequently Asked Questions About Internal Rate of Return Calculation
Is IRR the same as ROI? No. ROI measures total return as a percentage of investment, without considering when cash flows occur. IRR looks at the timing of cash flows, annualizing your return and accounting for early or late payments and receipts.
Can IRR be negative? Yes. If a project or investment fails to recover its initial outlay or has ongoing negative net cash flows, the IRR will be below zero—meaning it destroys value rather than creates it.
Why do some projects have more than one IRR? This happens when a project’s cash flow changes sign (from positive to negative or vice versa) more than once. This can cause the IRR equation to have multiple mathematical solutions. When in doubt, check the cash flow pattern or use other methods like MIRR for clarity.
Does a higher IRR always mean a better investment? Not necessarily. A higher IRR is only favorable up to the point where it exceeds your required rate of return or hurdle rate. Two projects may have different IRRs but different risks, scales, or durations, so you need to consider the full context before deciding.
Is IRR reliable for all types of investments? IRR works best for conventional investments—ones with a standard outflow followed by inflows. For projects with erratic or alternating cash flows, IRR can mislead. It’s wise to pair IRR with other metrics for a complete picture.
Armed with answers to these common questions, you’re better equipped to avoid pitfalls and spot calculation issues. Up next, let’s see how these principles translate through examples and case studies, making IRR come alive in real-world scenarios.