
Financial Ratios Cheat Sheet: Essential Formulas and Quick Reference
If you’ve ever tried to make sense of a company’s financial statements, you know it can be overwhelming. That’s where financial ratios come in—they help turn rows of numbers into clear insights. In fact, over 70% of financial analysts rely on key ratios to assess a business’s health and performance quickly. Whether you’re a student, investor, small business owner, or just want to understand how well a company is really doing, knowing these ratios makes the process a whole lot easier.
This cheat sheet brings together the most essential financial ratios, their formulas, and straightforward examples—all in one place. With a quick glance, you can measure profitability, spot liquidity issues, compare companies, or even track progress over time. Let’s demystify the numbers and learn how these simple tools can help you make smarter financial decisions.
Understanding Financial Ratios
What Are Financial Ratios?
Financial ratios turn raw accounting numbers into useful insights. By taking data from a company’s financial statements—like the balance sheet and income statement—ratios help you see patterns and relationships that raw figures alone can’t reveal. This simple math allows you to measure profitability, efficiency, liquidity, and more, all in just a few calculated seconds.
Why Ratios Matter for Analysis
The real power of financial ratios lies in comparison. Ratios strip away the noise, letting you compare businesses of different sizes or track a single company as it evolves. They pinpoint strengths and weaknesses: Is a business running efficiently? Are debts becoming unmanageable? Are profits growing? Ratios spotlight these answers far more quickly than sifting through pages of numbers.
Now that you know why ratios matter, let’s explore a cheat sheet that organizes the most essential formulas, so you can quickly find and use the right numbers in your analysis.
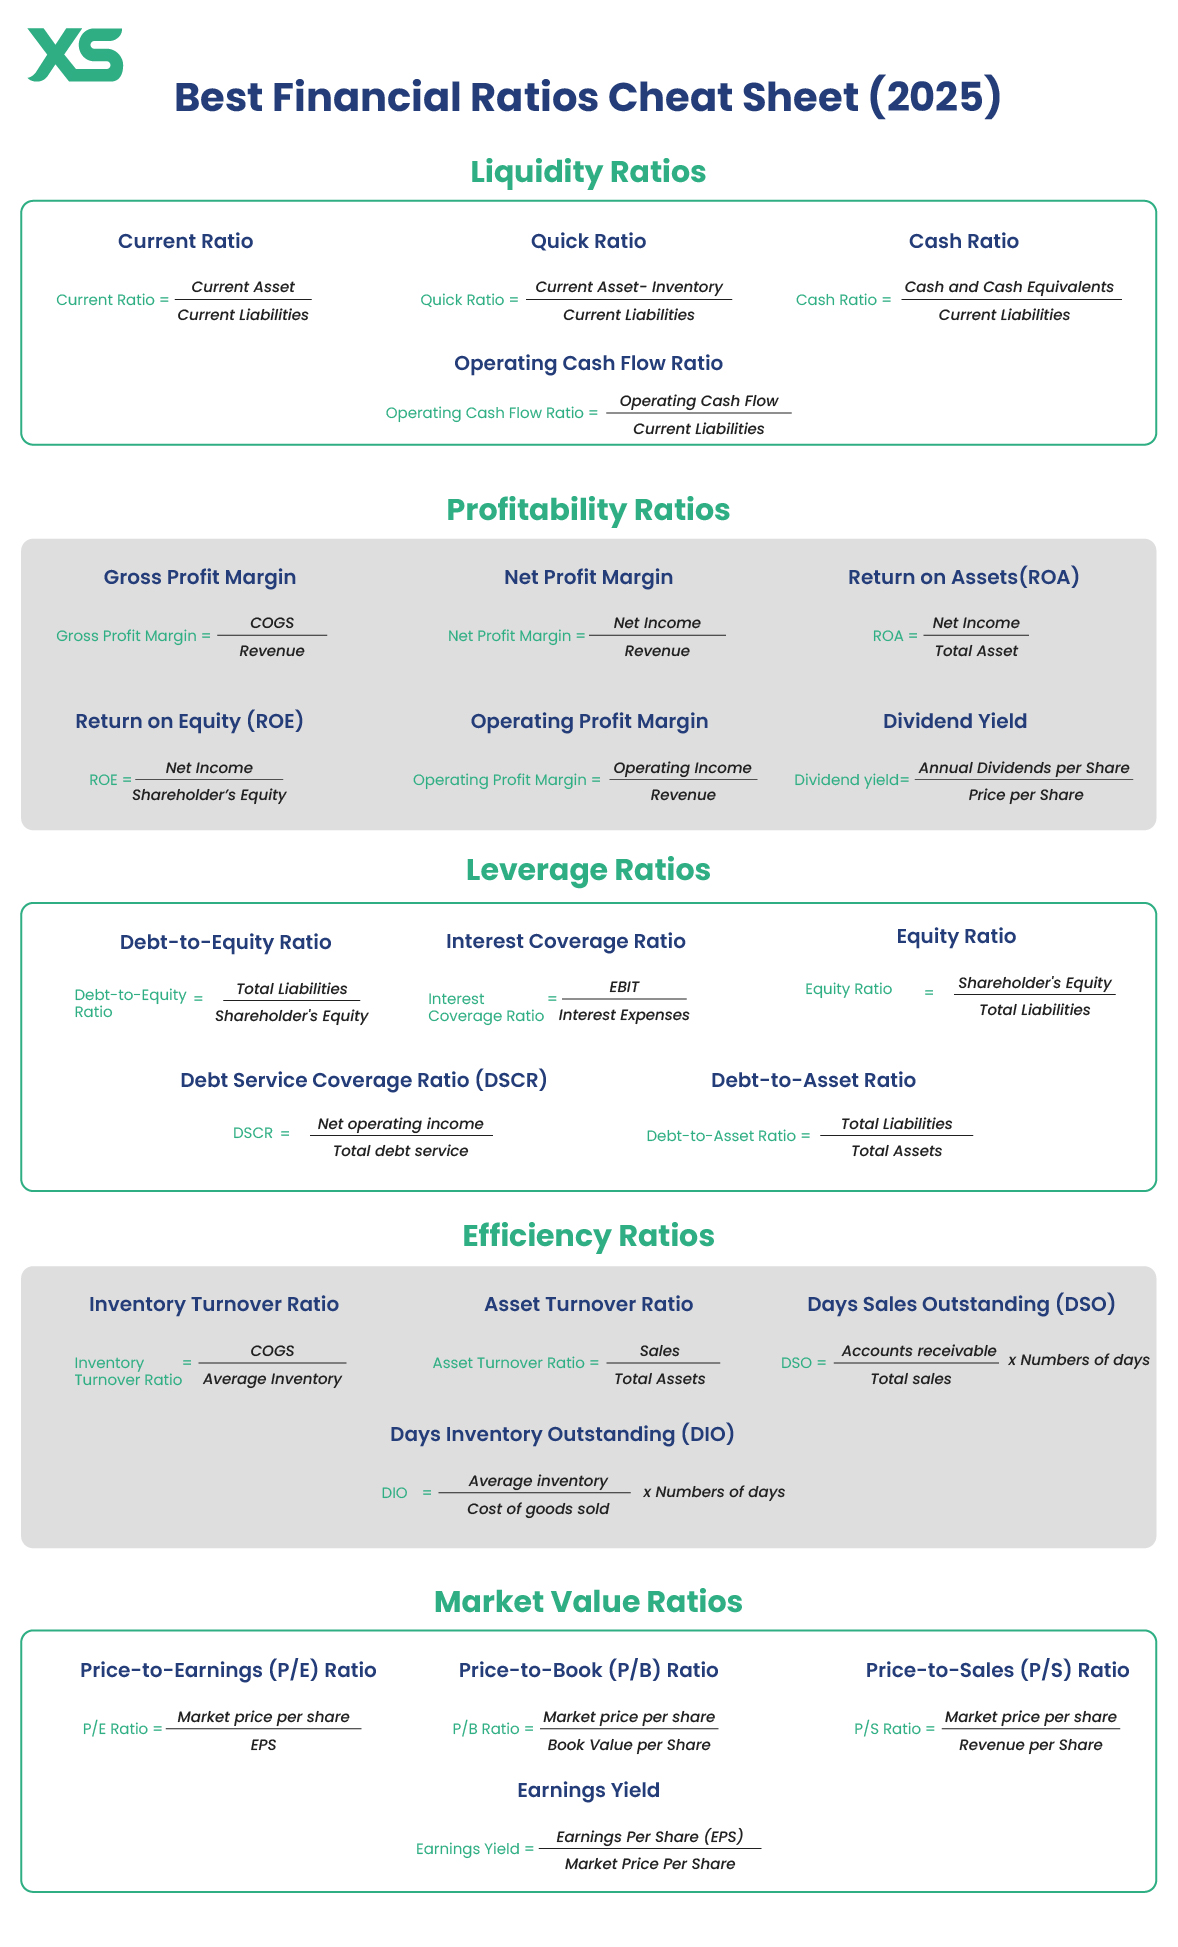
Quick-Access Financial Ratios Chart (PDF Download)
Keep this chart handy when analyzing any set of financial statements. Here are the formulas and essential ratios sorted by category, designed for instant lookup and easy memorization. If you want to download it, you can get a PDF version here.
Profitability Ratios
💰 Profitability Ratios
Profitability ratios measure how efficiently a company generates profit relative to sales, assets, or shareholder equity. They help investors assess how well management turns revenue into earnings.
-
Gross Profit Margin = (Revenue – COGS) / Revenue
Shows how much profit a company makes after covering direct costs of goods sold. A higher margin means better control over production costs. -
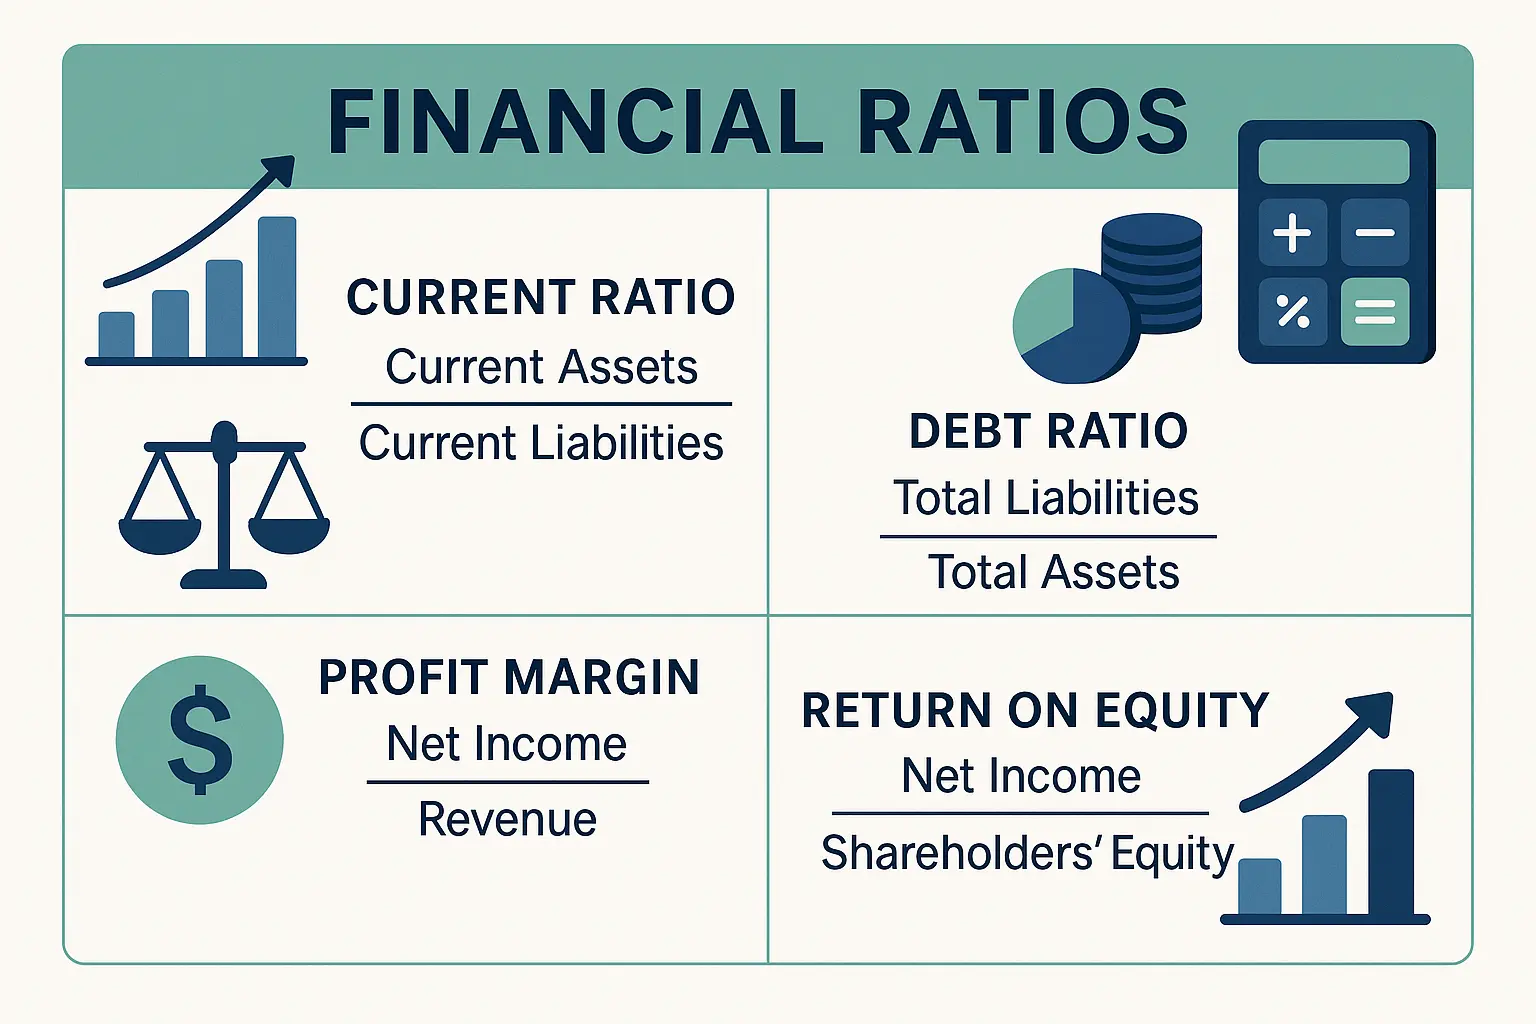
Net Profit Margin = Net Income / Revenue
Reveals the percentage of revenue left as profit after all expenses, interest, and taxes. It’s a key measure of overall profitability. -
Return on Assets (ROA) = Net Income / Total Assets
Measures how effectively a company uses its assets to generate profit. Higher ROA indicates efficient asset use. -
Return on Equity (ROE) = Net Income / Shareholders’ Equity
Shows the return generated on owners’ investments. Investors use it to assess management’s effectiveness at creating value. -
Operating Profit Margin = Operating Income / Revenue
Indicates how much profit remains after covering operating costs but before interest and taxes. Reflects core operational efficiency. -
Dividend Yield = Annual Dividends per Share / Price per Share
Shows the annual return an investor earns from dividends relative to the stock’s price.
💧 Liquidity Ratios
Liquidity ratios measure a company’s ability to meet short-term obligations. They show how easily assets can cover liabilities.
-
Current Ratio = Current Assets / Current Liabilities
Assesses whether short-term assets can pay off short-term debts. A ratio above 1.0 typically indicates good liquidity. -
Quick Ratio = (Current Assets – Inventory) / Current Liabilities
Also known as the acid-test ratio. It excludes inventory to focus on the most liquid assets. -
Cash Ratio = Cash and Cash Equivalents / Current Liabilities
The strictest liquidity test—shows if a company can meet obligations using only cash on hand. -
Operating Cash Flow Ratio = Operating Cash Flow / Current Liabilities
Measures whether cash from operations can cover current debts, offering a realistic liquidity picture.
🏦 Leverage (Solvency) Ratios
Leverage ratios evaluate a company’s long-term financial stability—specifically how much debt it uses relative to equity and assets.
-
Debt-to-Equity Ratio = Total Liabilities / Shareholders’ Equity
Indicates the proportion of debt versus owner financing. A high ratio may signal over-leverage. -
Interest Coverage Ratio = EBIT / Interest Expenses
Shows how easily a company can pay interest on its debt. A ratio below 2 may raise red flags. -
Debt Service Coverage Ratio (DSCR) = Net Operating Income / Total Debt Service
Assesses a company’s ability to service its total debt (principal + interest). A DSCR above 1 means the company generates enough income to pay its obligations. -
Debt-to-Asset Ratio = Total Liabilities / Total Assets
Measures how much of a company’s assets are financed by debt. Lower is generally better. -
Equity Ratio = Shareholders’ Equity / Total Liabilities
Shows the portion of assets financed by owners’ equity. A higher ratio implies less dependence on debt.
⚙️ Efficiency Ratios
Efficiency ratios reveal how effectively a company uses its assets and manages operations to generate revenue.
-
Inventory Turnover Ratio = COGS / Average Inventory
Indicates how often inventory is sold and replaced in a period. Higher turnover suggests strong sales or efficient inventory management. -
Asset Turnover Ratio = Sales / Total Assets
Shows how efficiently a company uses assets to generate sales. The higher the ratio, the better the efficiency. -
Days Sales Outstanding (DSO) = (Accounts Receivable / Total Sales) × Number of Days
Calculates how long it takes a company to collect payments from customers. Shorter periods indicate healthy cash flow. -
Days Inventory Outstanding (DIO) = (Average Inventory / COGS) × Number of Days
Reveals how long inventory stays before being sold. Lower DIO values indicate quicker turnover.
📈 Market Value Ratios
Market value ratios show how investors perceive a company’s worth relative to its earnings, assets, or sales. These are key for stock valuation.
Earnings Yield = Earnings per Share / Market Price per Share
The inverse of P/E ratio—shows the percentage return an investor earns per share at its current price.
Price-to-Earnings (P/E) Ratio = Market Price per Share / EPS
Shows how much investors are willing to pay for each dollar of earnings. High P/E can signal growth expectations—or overvaluation.
Price-to-Book (P/B) Ratio = Market Price per Share / Book Value per Share
Compares market value to accounting value. Ratios below 1.0 may indicate undervaluation.
Price-to-Sales (P/S) Ratio = Market Price per Share / Revenue per Share
Reflects how much investors pay for each dollar of sales. Useful for evaluating companies with little or no profit.
With this chart as your reference, you’re ready to move from raw formulas to understanding exactly how to calculate, interpret, and use each ratio in real scenarios. Let’s break down the logic behind the numbers and see them in action.
How to Calculate Each Key Ratio
Formulas and Example Calculations
Ratios deliver sharp insights, but only if you know how to find them. Let’s break down the essential calculations, pairing each with a quick, realistic scenario:
With these calculations, you’ll be able to quickly size up any company’s financial footing. Next, let’s look at how to actually use these numbers in real-world analysis to make more informed business decisions.
How to Use Financial Ratios Effectively
Benchmarks and Industry Comparisons
Calculating financial ratios reveals little until you compare them to something meaningful. Use industry averages, competitor results, or published benchmarks as reference points. A current ratio of 2.0 can be healthy or risky, depending on what’s typical for your sector. Context turns numbers into insight—always ask, “Is this figure above, below, or in line with others in the same space?”
Tracking Trends Over Time
Looking at a single ratio in isolation is like checking the weather for just one day. Analyze changes across quarters or years. Is profitability drifting downward? Is leverage creeping higher with each annual report? Spotting trends alerts you to strengths, weaknesses, and emerging issues early—often before they show up elsewhere.
With these methods, you can decode what your ratios are signaling and identify hidden shifts in performance. Next, let’s consider what these ratios might miss and where extra caution is warranted when relying on them alone.
Limitations of Financial Ratios
Financial ratios pack valuable insights into simple numbers, but they can mislead if read in isolation or out of context. For starters, ratios rely on historical data from financial statements. When those statements contain outdated information or involve accounting choices that don’t reflect current realities (such as depreciation methods or inventory valuation), your analysis can end up skewed.
Comparing ratios across different companies isn’t always apples to apples. Businesses vary in size, structure, industry norms, and accounting practices. For example, a tech startup and a manufacturing giant will naturally have dissimilar asset turnovers or profit margins, making side-by-side comparison potentially misleading.
Ratios can’t spot hidden risks. A company with attractive liquidity or profitability ratios could still be vulnerable to off-balance sheet liabilities, sudden regulatory changes, or a key contract expiring. Numbers capture a snapshot—not the full movie behind a business’s health.
Some ratios are also easily “dressed up.” A business might delay expenses or accelerate revenue at quarter-end to bump up its short-term results. Without context, that financial window dressing inflates the numbers, showing a rosier picture than reality.
Finally, ratios don’t answer the “why.” A declining margin might hint at trouble—but digging further is necessary to uncover whether it’s due to rising costs, pricing pressure, or a strategic investment for future growth.
To make financial ratios genuinely useful, it’s essential to look beyond the numbers and combine them with clear documentation. Up next, learn how to access and use a practical summary that puts key formulas and definitions right at your fingertips.
FAQs About Financial Ratios
What is the easiest way to remember key financial ratios?
Create associations between what the ratio measures and its formula. For example, profitability ratios compare profits to sales or assets, while liquidity ratios look at a company’s ability to pay bills soon. Practice with real company data can also cement the formulas in memory.
Which ratios do banks or investors care about most?
Banks often focus on liquidity and leverage ratios such as the current ratio and debt-to-equity ratio. Investors may zero in on profitability ratios like return on equity or market metrics such as the price-to-earnings ratio.
Are higher ratios always better?
No. While high profitability ratios are good, excessively high leverage ratios can mean too much debt risk. Context is key—compare with industry averages, not just absolute numbers.
How often should financial ratios be calculated?
Larger businesses monitor ratios quarterly or monthly. For small businesses, a quick check each quarter usually works unless there’s rapid change or concern. More frequent reviews help spot problems early.
Do ratios alone give the full financial picture?
Ratios are only part of the story. They highlight strengths or red flags, but don’t explain why performance is trending up or down. Combine ratio analysis with deeper looks at business operations and external factors.
Understanding commonly asked questions removes some of the mystery from financial ratio analysis. Now, with the basics out of the way, let’s dive deeper into practical resources you can keep by your side for quick reference and everyday use.