
Current Ratio and Liquidity Ratio: What They Mean and How They Work
Understanding how much cash or liquid assets a business has on hand isn’t just for accountants—it’s something every business owner, investor, or manager should know. That’s where the current ratio and other liquidity ratios come in. These numbers act like a snapshot of a company’s ability to pay its short-term bills. In fact, a 2023 survey by the National Small Business Association found that 25% of small businesses couldn’t meet their financial obligations on time due to cash flow problems. Knowing your company’s liquidity ratios can help keep you from becoming part of that statistic.
But it’s not just about avoiding trouble. Understanding what current and liquidity ratios mean, how to calculate them, and what they say about a business’s financial health can make it easier to make smart decisions—whether you run your own company, manage finances, or are simply trying to better understand the numbers behind a business. In this article, we’ll break down what these ratios are, how they work, and why they matter, using real-world examples and simple explanations along the way.
Current Ratio and Liquidity Ratio Explained
Understanding a company’s ability to pay its short-term obligations is the backbone of smart financial analysis. Two tools rise to the surface: the current ratio and liquidity ratios. While both measure a business’s capacity to cover debts, each approaches the challenge from a slightly different angle.
Why these ratios matter
Imagine a company gets hit by an unexpected bill or a dip in sales. How does it stay afloat? Liquidity ratios—like the current ratio, quick ratio, and cash ratio—shine a spotlight on whether there’s enough cash or near-cash assets to weather those storms. Lenders, investors, and managers all keep a close eye on these metrics because healthy ratios signal a cushion against surprises. Weak ratios, on the other hand, may spark tough questions or signal brewing financial trouble.
Where they fit in financial analysis
Liquidity ratios form a key part of the broader financial health check. Alongside measures like profitability and leverage, they help paint a full picture of a business’s outlook. While some ratios focus on longer-term stability, liquidity ratios zero in on the company’s ability to keep the lights on from week to week.

Examining colorful financial statements, charts, and spreadsheets can quickly reveal just how these ratios fit into the analysis. The paperwork is more than a formality—it’s where cash positions, accounts receivable, and inventory add up to the liquidity puzzle.
Now that we’ve clarified why these ratios sit at the heart of financial evaluation, it’s time to dig into the precise formulas and step-by-step calculations that bring them to life.
How to Calculate Current Ratio and Other Liquidity Ratios
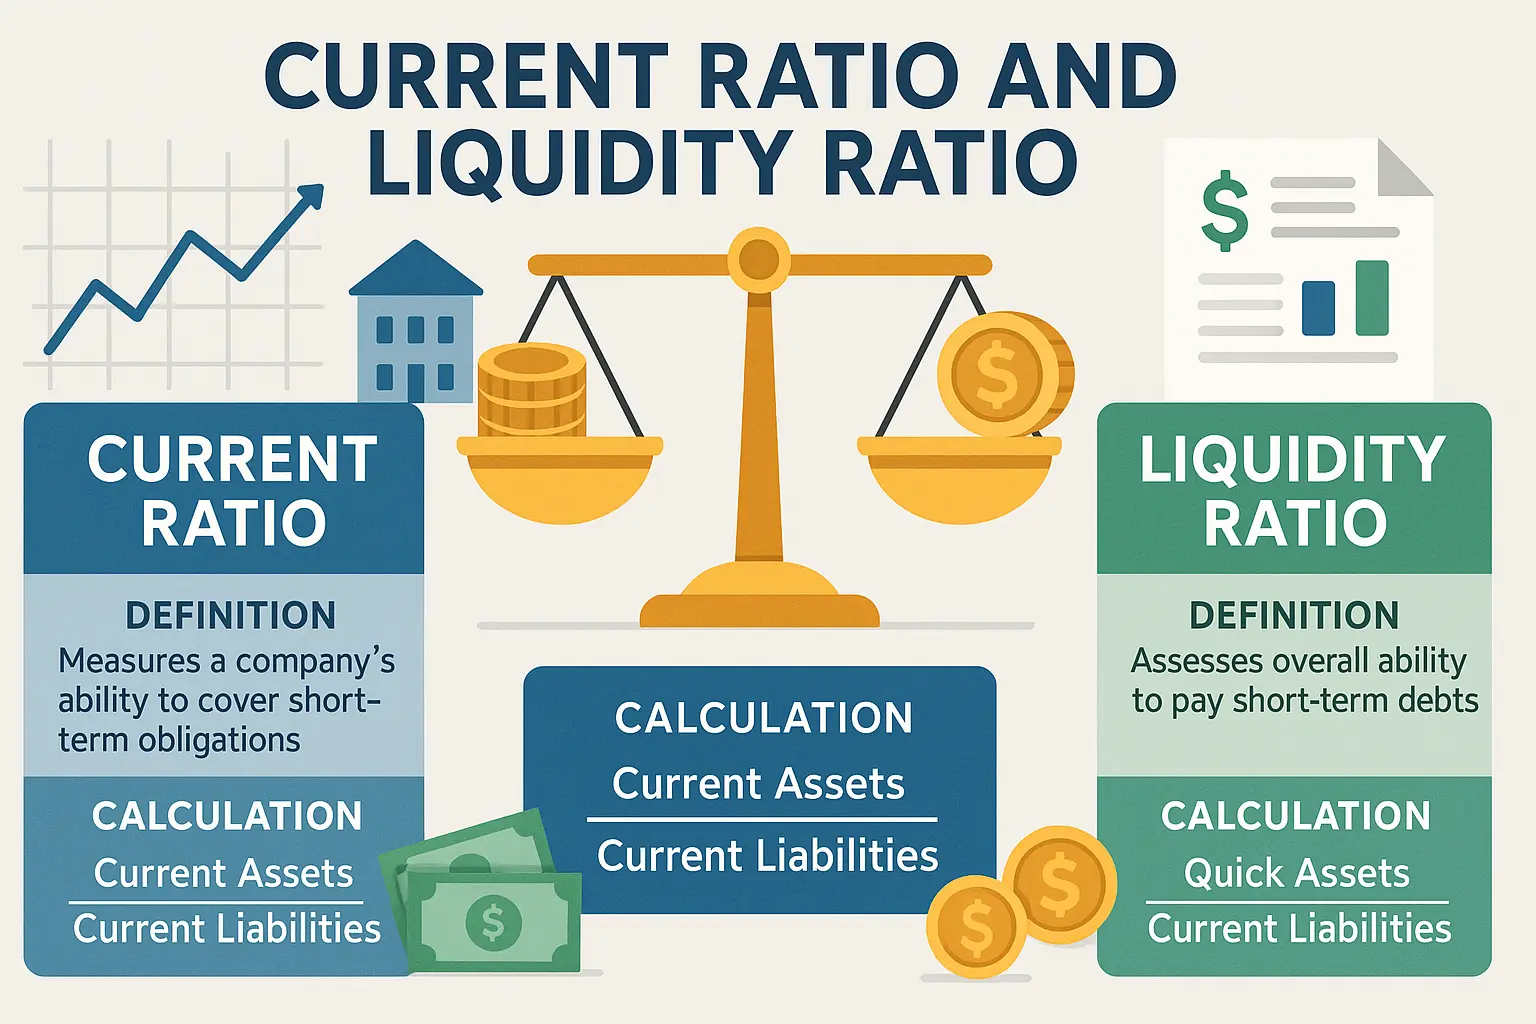
Current Ratio: Formula and Calculation
The current ratio measures a company’s ability to cover its short-term obligations with its short-term assets. To calculate it, you’ll only need two numbers from the balance sheet: current assets and current liabilities.
The formula is straightforward:
Current Ratio = Current Assets / Current Liabilities
For example, if a business has $120,000 in current assets and $60,000 in current liabilities, the current ratio is 2.0. This means the company has twice as many liquid resources as it needs to pay off its short-term debts.
Quick Ratio and Cash Ratio: Key Variations
While the current ratio includes all current assets, some analysts prefer a more cautious calculation that strips out items that can’t be quickly turned into cash. Enter the quick ratio and cash ratio.
The quick ratio, also known as the acid-test ratio, refines the calculation by removing inventory and other assets that might not sell instantly. The formula looks like this:
Quick Ratio = (Current Assets – Inventory) / Current Liabilities
The cash ratio takes it one step further. It considers only the most liquid resources—cash and cash equivalents—against short-term debts.
Cash Ratio = (Cash + Cash Equivalents) / Current Liabilities
By comparing these ratios, you can see how a business would handle its obligations if inventory couldn’t be readily turned into cash, or if only the most liquid reserves were available.
Now that you know how to calculate these key ratios, it’s important to understand the difference between them and how each can tell a different story about a company’s financial state. Let’s dig deeper into what sets them apart and when to use each for the clearest picture of liquidity.
Current Ratio vs. Liquidity Ratio: What’s the Difference?
What each ratio tells you
The current ratio focuses on a company’s ability to cover its short-term obligations using all current assets—including inventory and prepaid expenses. It’s a single number that answers: If we had to pay every bill due in the next year, could we?
Liquidity ratio is a broader category. The term covers not just the current ratio, but also the quick ratio and cash ratio. Each offers a stricter definition of “liquid.” For example, the quick ratio only counts assets that can become cash in a flash, excluding inventory and prepaid expenses. The cash ratio is even more demanding, including only pure cash and cash equivalents.
Situations where each is most useful
When you need an all-around view of short-term financial health, the current ratio is helpful—it offers a snapshot of available resources versus looming bills. However, if you’re looking for a more conservative assessment (for instance, during a sudden cash crunch or when inventory might be hard to sell), quick and cash ratios come into play. Lenders and investors often prefer these tighter measures to confirm a business can weather bumps without selling inventory or waiting for receivables to come in.
Understanding which ratio to use depends on your goals. Now, let’s walk through exactly how these ratios are calculated and see how they play out in real-world scenarios.
Examples: Working with Current and Liquidity Ratios
Step-by-step calculation
Let’s imagine a company, GreenTech Supplies, with the following on its balance sheet: $80,000 in cash, $30,000 in inventory, $40,000 in accounts receivable, and $70,000 in accounts payable (current liabilities). To see how healthy this company is, we start with the current ratio.
The formula is straightforward: current assets divided by current liabilities. Here, current assets equal $80,000 (cash) + $30,000 (inventory) + $40,000 (accounts receivable) = $150,000. Divide that by $70,000 and GreenTech ends up with a current ratio of 2.14. This means GreenTech has about $2.14 available for every $1 it owes in the short term.
The quick ratio skips the inventory—since it’s not always easy to turn stock into cash fast. Quick assets here are $80,000 (cash) + $40,000 (accounts receivable) = $120,000. The quick ratio: $120,000 ÷ $70,000 = 1.71. This shows GreenTech can cover its bills even if inventory doesn’t sell quickly.
Real-world examples
Retailer: RapidMart keeps $60,000 in cash, $90,000 in inventory, $50,000 in receivables, and owes $120,000. Its current ratio is ($60,000 + $90,000 + $50,000) ÷ $120,000 = 1.67. A figure above 1 means RapidMart can cover its short-term debts, but much of its liquidity is tied up in inventory. The quick ratio, excluding stock, is ($60,000 + $50,000) ÷ $120,000 = 0.92. That’s under 1, so RapidMart may struggle to pay bills if they can’t shift inventory quickly.
Tech Startup: ByteLeap has $250,000 in cash, $10,000 in receivables and only $20,000 in payables. Its current ratio is ($250,000 + $10,000) ÷ $20,000 = 13, and its quick ratio is the same, since it doesn’t hold inventory. Here, the business is highly liquid—perhaps it’s waiting to invest or hasn’t expanded operations yet.
These examples show how current and quick ratios spotlight different aspects of a business’s ability to pay its debts, providing more dimension than a single number alone.
Understanding these calculations is only half the picture—the next important step is knowing what the results reveal about a business’s financial health and what action you might take when ratios signal trouble or opportunity.
How to Interpret Ratio Results
What is a good current or liquidity ratio?
The ideal current or liquidity ratio isn’t the same for every business. As a general guideline, a current ratio between 1.5 and 2 is often considered healthy. This suggests a company has enough short-term assets to comfortably handle its short-term debts. A quick ratio above 1 is typically positive, indicating assets can quickly cover urgent obligations without relying on inventory.
However, what counts as “good” really depends on the industry. Retailers, for instance, often operate with lower ratios because inventory sells fast. Manufacturing businesses may keep higher ratios to buffer against slow-moving stock or supply chain hiccups. To judge a company’s ratio, compare it to both industry averages and to the company’s own recent history.
What high or low ratios mean in practice
A high current or liquidity ratio can look reassuring, but it’s not always a sign of strength. If a business is sitting on cash or inventory it isn’t using, it may be missing opportunities to invest or grow. In some cases, a very high ratio can point to inefficiency.
Conversely, a low ratio signals possible trouble—especially if it dips below 1. This means the company may not have enough assets to meet short-term obligations, risking late payments or, worse, insolvency. Occasional dips are common, especially in seasonal businesses right before cash comes in, but a consistently low ratio is a warning sign investors and lenders pay close attention to.
Think of these ratios as early indicators. They won’t tell you why there’s a problem, but they’ll highlight where to start looking.
Understanding the meaning behind the numbers is only half the story. It’s just as important to recognize the factors and limitations that can skew these ratios or lead to misinterpretation—the next section explores these traps and how to avoid them.
Limitations and Caveats
Common misinterpretations
On the surface, a high current or liquidity ratio can look reassuring. However, this number alone doesn’t guarantee a strong financial position. Sometimes, companies carry excessive inventory or large accounts receivable, both of which inflate the ratio but may not be swiftly converted into cash. Relying solely on the current ratio can lead to a false sense of security if those assets are not actually liquid.
Another pitfall: assuming ratios above a generic “safe” threshold (like 2:1) always signal health. Industry norms and company size can make these benchmarks unreliable. It’s possible for a healthy business to have a lower ratio—just as a struggling business might show a deceptively robust figure before trouble hits.
Context: Industry and seasonal factors
Liquidity ratios are not universal yardsticks. For example, supermarkets often run with low ratios because inventory moves fast and cash flows are steady. Construction companies, on the other hand, might post higher ratios due to payment schedules or project cycles, even if their actual financial flexibility is limited.
Seasonal swings can also skew results. A retailer loaded with unsold inventory after the holidays may temporarily show a high current ratio, but face cash shortages when bills come due. Judging a company by one snapshot in time ignores fluctuations over the business year.
To make sense of these ratios, it’s crucial to compare them not just against general guidelines, but to benchmark peers and watch trends over several accounting periods.
Grasping these subtleties sets the stage for practical steps you can take if your own ratios need improvement or steadying over time.
Improving Your Ratios: Practical Tips
Boosting your current ratio and other liquidity measures starts with clear steps, not abstract goals. Here’s how you can move the needle:
Collect faster, pay smarter: Speeding up your invoicing cycle and following up on outstanding payments brings cash in quicker. On the flip side, don’t pay bills before they’re due unless there’s a benefit (like an early payment discount). The longer cash sits in your account, the stronger your ratios.
Rethink inventory: Inventory ties up cash. If you’re overstocked, consider sales promotions or discounts to turn it into cash. For regular operations, buy inventory in quantities that match sales trends, not optimistic forecasts. Less overstock means more liquidity.
Refinance short-term debts: If you’re stuck with heavy short-term repayment obligations, look at refinancing some debt into longer-term loans. This gives you breathing room and improves your short-term ratio without resorting to drastic measures.
Avoid unnecessary current liabilities: Think before taking on short-term loans or using credit for purchases. Each new current liability lowers your current ratio. Only add these when there’s a clear payoff.
Monitor and forecast: Don’t let poor ratios catch you by surprise. Use cash flow forecasting, review your ratios monthly, and adjust as you spot trends. Even small tweaks in operations can tip the scales in your favor if you catch warning signs early.
Improving these ratios is about practical habits, not a one-off fix. As you sharpen your approach, keep in mind that ratios don’t tell the full story on their own. In the next part, you’ll see common questions—and careful answers—about what these numbers reveal and the real-world decisions they influence.
Frequently Asked Questions
How do liquidity ratios affect lending decisions?
Banks and other lenders use liquidity ratios to gauge whether a business can handle its short-term obligations if revenue drops. Strong ratios often translate into better lending terms, while weak liquidity might result in higher interest rates or even rejection.
Can a very high current ratio be a warning sign?
Yes, a current ratio that’s much higher than industry norms can signal the company is holding onto excessive inventory or idle cash, rather than investing in growth or operational needs. This may point to inefficiencies in managing resources.
Difference between current, quick, and cash ratios
The current ratio includes all current assets. The quick ratio excludes inventory and prepaid expenses, focusing only on the assets that can be quickly converted to cash. The cash ratio is the strictest, looking only at cash and cash equivalents. Each ratio offers a different angle on short-term financial strength.
Now that we’ve addressed common questions, let’s look at how you can apply these insights to actively improve your own financial ratios—and strengthen your business’s financial health over time.